


Contents
Introduction
Despite being one of the most mature sectors in the crypto space, DeFi projects have shown disappointing performance in this bull run. Over the past year, the DeFi sector has seen a modest increase of 41.3%, significantly lagging behind the average market growth of 91% and Ethereum’s 75.8% rise.
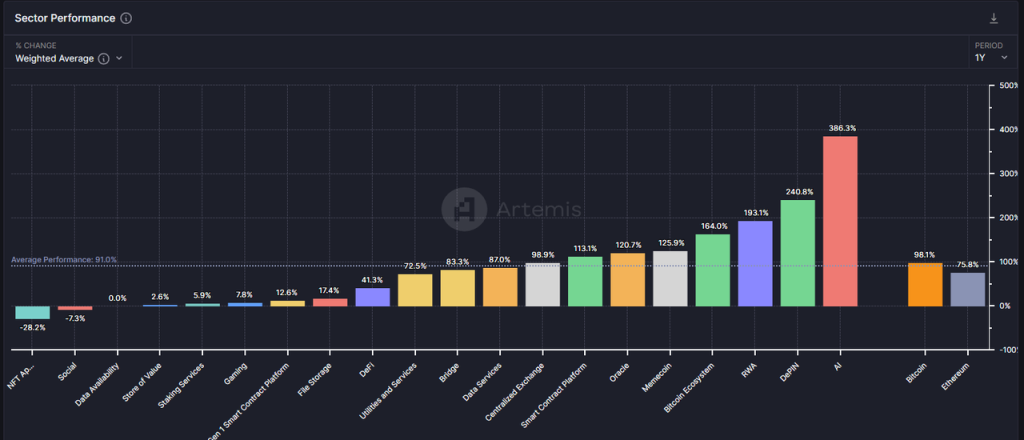
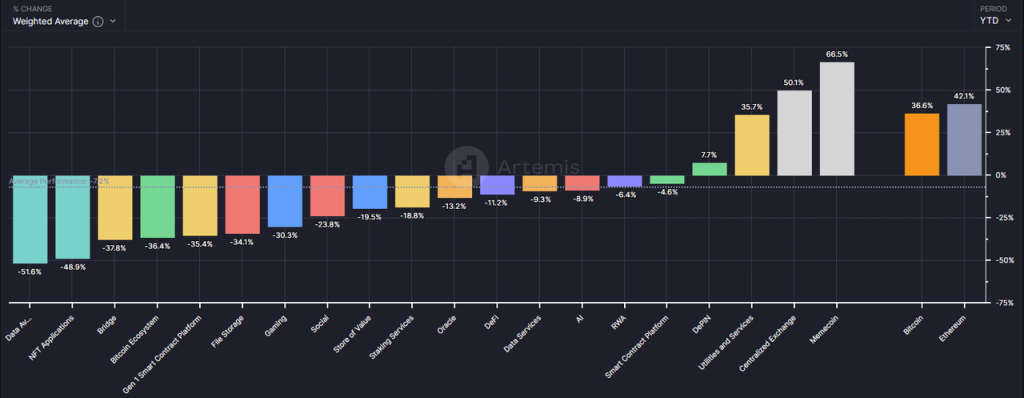
Focusing on the data from 2024 alone, the performance of the DeFi sector is hard to say positive, with an overall decline of 11.2%.
However, from my perspective, in the unusual market context where altcoin prices have collectively dropped following BTC’s new high, some leading DeFi projects may have reached the optimal time for strategic investment.
In this article, I aim to clarify the current value of DeFi by exploring the following questions:
- The reasons behind altcoin’s significant underperformance compared to BTC and Ethereum in this cycle
- Why now is the best time to focus on DeFi
- Some DeFi projects worth paying attention to, along with their sources of value and associated risks
This article does not aim to cover all DeFi projects with investment potential in the market. The DeFi projects mentioned are merely analysis examples and are not financial advice.
Please note that this article reflects my current thinking and may evolve. The opinions here are subjective and may be facts, data, and logical reasoning errors. Feedback and discussions are welcomed.
The Enigma of the Steep Decline in Altcoin Prices
In my view, the disappointing performance of altcoin prices in this cycle can be attributed to three main internal factors within the crypto industry:
- Insufficient Demand Growth: There is a lack of attractive business models, and most crypto sectors are far from achieving product-market fit (PMF).
- Supply-Side Overgrowth: With the infrastructures becoming more robust and entry barriers lowering, new projects have been excessively issued.
- Persistent Token Unlocking: The continuous unlocking of tokens from low-circulation, high FDV (Fully Diluted Valuation) projects has led to significant selling pressure.
Let’s look at each of the three reasons in detail.
Insufficient Demand Growth: The First Bull Market Lacking Innovative Narratives
In my early March article, “Preparing for Primary Wave: My Periodic Strategy on This Bull Market Cycle,” I pointed out that this bull market lacks the scale of business innovation and narratives seen in the DeFi boom of 2021 and the ICO surge of 2017. Hence, the strategy should be to overweight BTC and ETH (benefiting from the influx of funds from ETFs), and to control the allocation to altcoins.
To date, my observation has proven to be accurate.
The absence of new business stories has reduced the influx of entrepreneurs, investments, users, and funds. More importantly, this has dampened investors’ overall expectations for industry growth. When the market lacks compelling stories like “DeFi will disrupt traditional finance,” “ICO is a new paradigm for innovation and financing,” and “NFTs are revolutionizing the content industry ecosystem,” investors naturally gravitate towards sectors with new narratives, such as AI.
However, I do not support overly pessimistic views. Although we have not yet seen attractive innovations in this cycle, the infrastructure is continuously improving:
- The cost of block space has significantly decreased across both Layer 1 (L1) and Layer 2 (L2) solutions.
- Cross-chain communication solutions are becoming more comprehensive, offering a wide array of options.
- Wallets upgraded their experiences to become more user-friendly. For example, Coinbase’s smart wallet supports keyless quick creation and recovery, direct calling of CEX balances, and eliminating the need to top up gas, providing users with a better product experience.
- Solana’s Actions and Blinks features allow interactions with the Solana blockchain to be published in any common internet environment, further shortening the user journey.
These infrastructure is like real-world water, electricity, coal, and roads. They are not the result of innovation but are the soil from which it springs.
Excessive Supply Growth: Over-Issuance of Projects and Continuous Token Vesting of High-Market-Cap Projects
In fact, looking from another angle, although the prices of many altcoins have hit new lows for the year, the total market capitalization of altcoins relative to BTC has not suffered as severely.
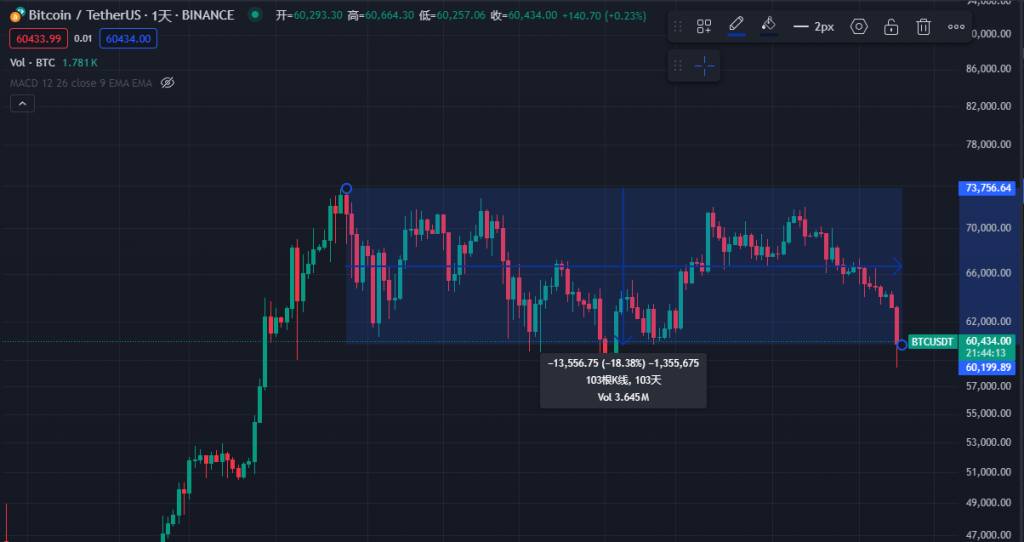
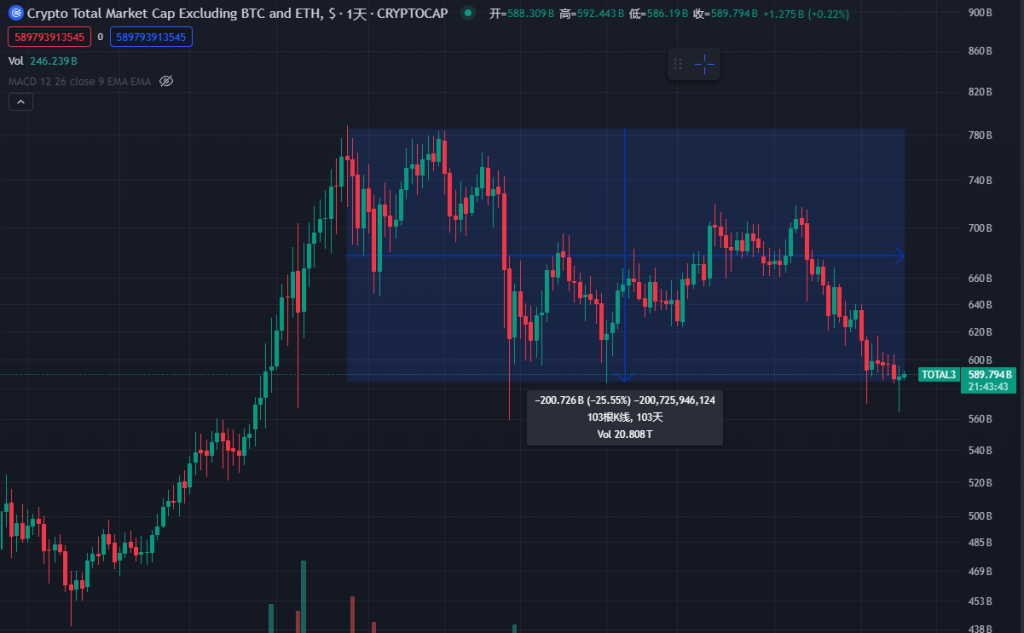
BTC’s price has fallen by approximately 18.4% from its peak, while the total market cap of altcoins has only decreased by 25.5%.
Note: Altcoins’s market cap refers to the total crypto market cap excluding BTC and ETH, namely “Total3” in the Trading View system.
The limited decline in the total market cap of altcoins occurs against a backdrop of significant expansion in the total quantity and market cap of newly issued altcoins. The chart below clearly illustrates that during this bull market, the growth trend in new tokens is the most rapid in history.
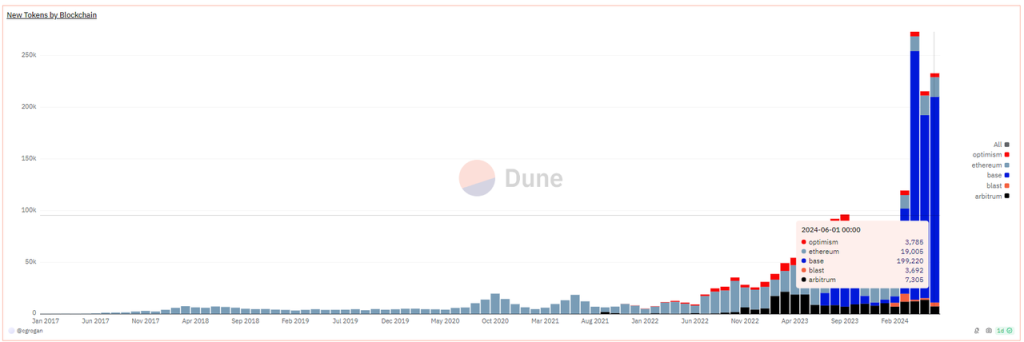
It is important to note that the above data only includes newly-issued tokens on EVM chains, with over 90% issued on the Base chain. In reality, even more new tokens have been issued on Solana. Whether on Solana or Base, most of the newly issued tokens are memecoins.
Among the high market cap memecoins that have emerged in this bull market are:
| Memecoins | Circulating Market Cap ($million) |
| Dogwifhat | 2,040 |
| Brett | 1,660 |
| Notcoin | 1,610 |
| DOG•GO•TO•THE•MOON | 630 |
| Mog Coin | 560 |
| Popcat | 470 |
| Maga | 410 |
In addition to memecoins, a large number of infrastructure concept tokens are or will be issued on the exchange this year.
Layer2 Solutions
| L2 Solutions | Circulating Market Cap ($billion) | FDV ($billion) |
| Starknet | 0.93 | 7.17 |
| ZKsync | 0.61 | 3.51 |
| Manta Network | 0.33 | 1.02 |
| Taiko | 0.12 | 1.9 |
| Blast | 0.48 | 2.81 |
Cross-chain Services
| Cross-chain Services | Circulating Market Cap ($billion) | FDV ($billion) |
| Wormhole | 0.63 | 3.48 |
| Layerzero | 0.68 | 2.73 |
| Zetachain | 0.23 | 1.78 |
| Omni Network | 0.147 | 1.42 |
Modular Blockchains
| Modular Blockchains | Circulating Market Cap ($billion) | FDV ($billion) |
| Altlayer | 0.29 | 1.87 |
| Dymension | 0.3 | 1.59 |
| Saga | 0.14 | 1.5 |
*The market cap is sourced from Coingecko as of June 28, 2024.
Additionally, many tokens listed on CEXs are facing substantial vesting. These tokens commonly have low circulation ratios, and high FDVs, and have undergone early VC funding rounds, resulting in low token costs for institutions.
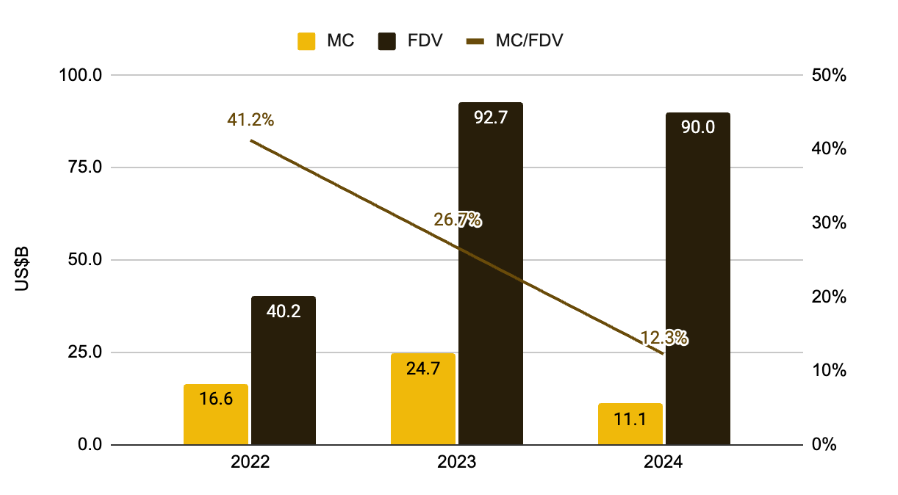
The combination of weak demand and narratives, along with over-issuance on the supply side, is an unprecedented situation in the crypto cycle. Despite manual efforts to sustain valuations by further reducing the token circulation ratio at the time of listing – from 41.2% in 2022 to 12.3% in 2024 – and gradually selling to secondary investors, the convergence of these factors has led to an overall downward shift in the valuation of these crypto projects. In 2024, only a few concepts, such as Memecoins, CEX, and DePIN, have managed to maintain positive returns.
However, from my perspective, the valuation collapse of high market cap VC Token is a normal market response to various crypto anomalies:
- Duplicate creation of Rollups, leading to the ghost-town phenomenon that high-TVL projects are filled with bots but lack authentic users
- Raising funds by rebranding terms while providing essentially similar solutions, especially among cross-chain communication services
- Launching projects based on trends rather than actual user needs, such as numerous AI+Web3 projects
- Projects fail to find profitable models and their tokens with no ability to capture value
The overall decline in the valuation of these altcoins is a result of the market’s self-correction. It is a healthy process of the bubble bursting, where funds vote with their feet, leading to a market clearing and self-rescue.
The reality is that most VC coins are not entirely without value; they were simply overpriced, and the market has finally adjusted them to their rightful positions.
The Right Time to Focus on DeFi: PMF Products Emerging from the Bubble
Since 2020, DeFi has officially become a category within the altcoin ecosystem. In the first half of 2021, the Top 100 crypto market cap rankings were dominated by DeFi projects, with a dizzying array of subcategories, all aiming to replicate every existing business model in traditional finance on the blockchain.
During that year, DeFi was the fundamental module of public chains, and DEXs, lending platforms, stablecoins, and derivatives became the essential components for any new public chain.
However, with the over-issuance of similar projects, numerous hacker attacks or insider jobs, and the rapid collapse of TVL obtained by relying on Ponzi schemes, the once soaring token prices spiraled down to zero.
As we enter the current bull market cycle, the price performance of most surviving DeFi projects has been unsatisfactory, and primary investments in the DeFi sector have dwindled. As is typical at the start of any bull market, investors are most attracted to the new narratives emerging in this cycle, and DeFi does not fit into that type.
However, it is precisely for this reason that DeFi projects, surviving from the bubble, are beginning to look more attractive than other altcoin projects. Specifically:
- Business Overview: They have mature business models and profit models, and leading projects have competitive edges
DEXs and derivatives earn trading fees, lending platforms generate income from interest spreads, stablecoins collect stability fees, and staking projects charge fees for their services. These sectors have clear profit models. Leading projects in each sector have organic user demand, have largely moved past the subsidy phase, and some have achieved positive cash flow even after accounting for token emissions.
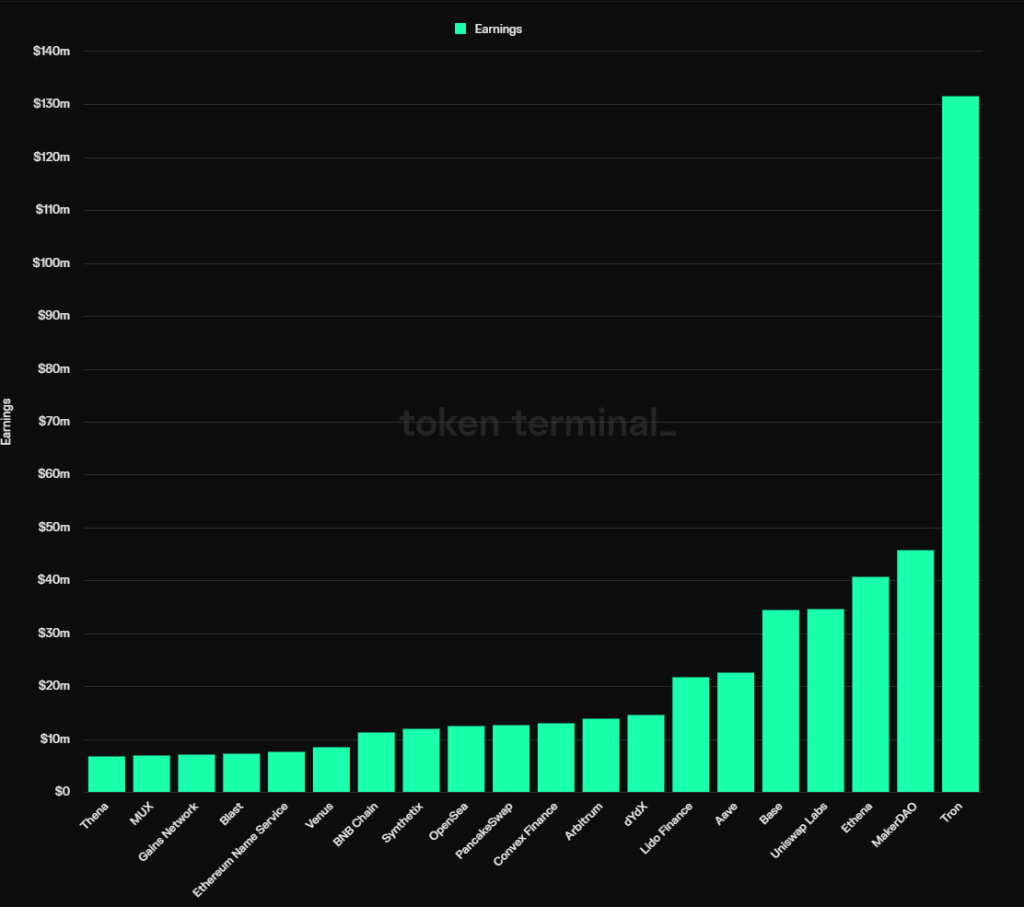
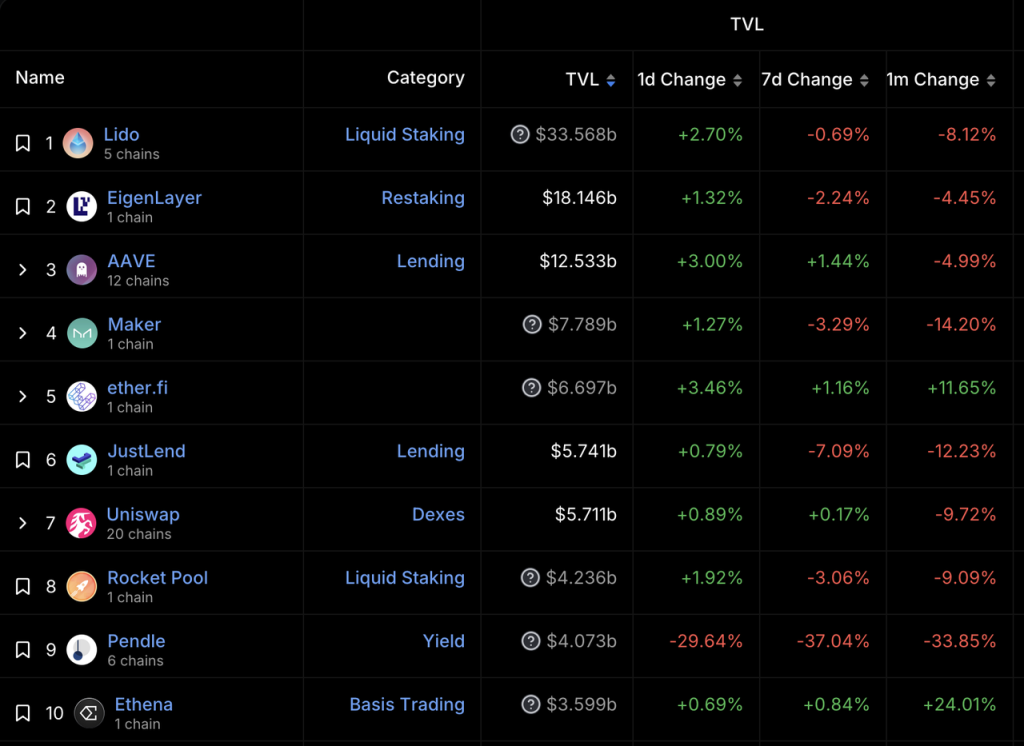
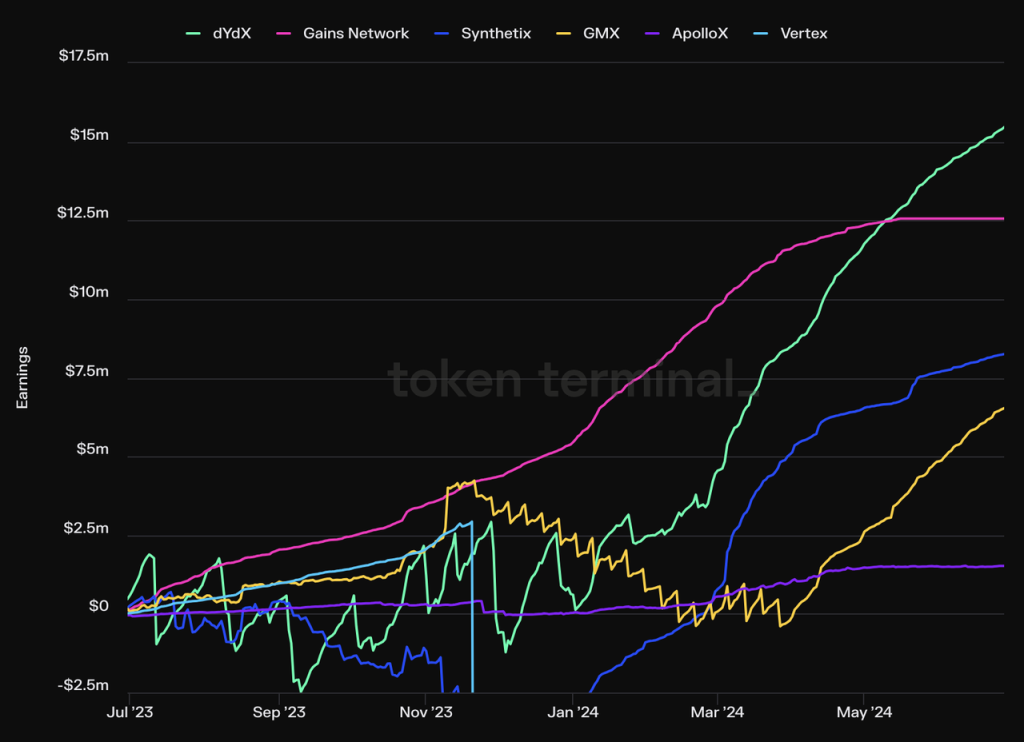
According to statistics from Token Terminal, as of 2024, 12 of the top 20 most profitable protocols are DeFi projects. By category, they include:
- Stablecoins: MakerDAO, Ethena
- Lending: Aave, Venus
- Staking Services: Lido
- DEX: Uniswap Labs, PancakeSwap, Thena (earning from trading fees)
- Derivatives: dYdX, Synthetix, MUX
- Yield Aggregators: Convex Finance
These projects have various competitive advantages, which can derive from multi-sided or bilateral network effects, user habits and brand recognition, or unique ecosystem resources. However, the leading DeFi projects in their respective sectors share some common traits: stabilizing market share, fewer later competitors, and service pricing power.
We will analyze thesel DeFi projects in detail later.
- Supply Side: Low Emissions, High Circulation Ratio, Minimal Token Unlocking
In the previous section, we noted that one of the main reasons for the continuous decline in the current cycle of altcoin valuation is the high emissions from many projects based on inflated valuations, coupled with the negative expectations from the large-scale unlocking of tokens.
In contrast, leading DeFi projects, due to their earlier launch dates, have mostly passed their peak token emission periods, and institutional tokens have largely been released, resulting in minimal future selling pressure. For example, Aave currently has a token circulation ratio of 91%, Lido’s is 89%, Uniswap’s is 75.3%, MakerDAO’s is 95%, and Convex’s is 81.9%.
This is partly an indication of low future dumping pressure, but it also means that whoever wants to gain control of these projects will have to buy tokens from the market.
- Valuation Analysis: Divergence Between Market Attention and Business Metrics, Valuation Levels at Historical Lows
Compared to new concepts like Meme, AI, DePIN, Restaking, and Rollup services, DeFi has gained very little attention in this bull market, and its price performance has been mediocre. However, the core business metrics of leading DeFi projects, such as trading volume, lending scale, and profit levels, have continued to grow. This divergence between price and business metrics has resulted in the valuation levels of some leading DeFi projects reaching historical lows.
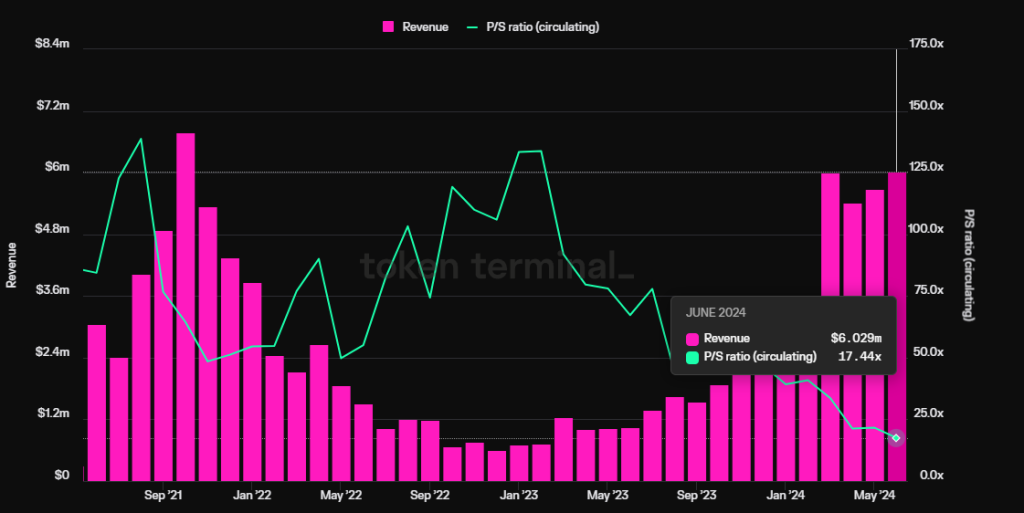
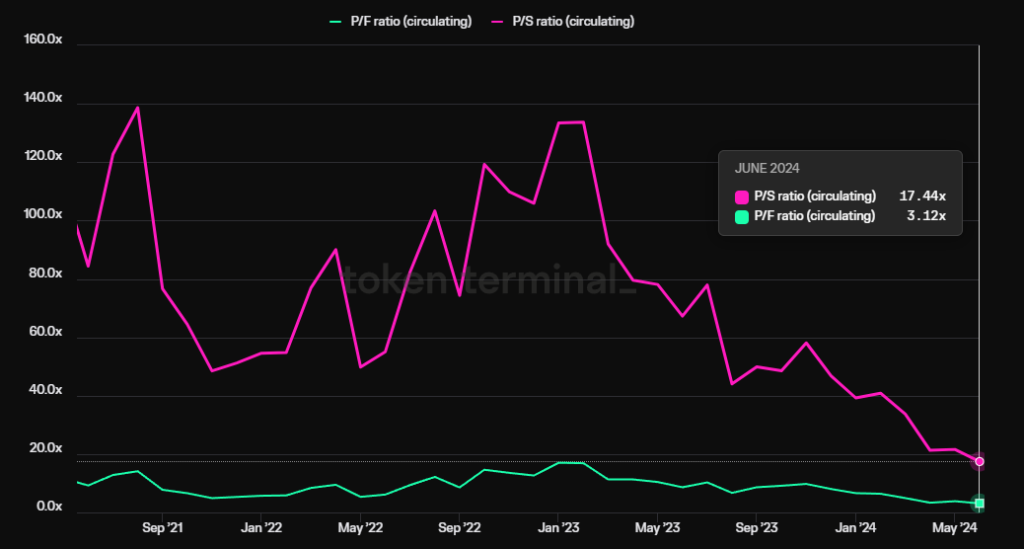
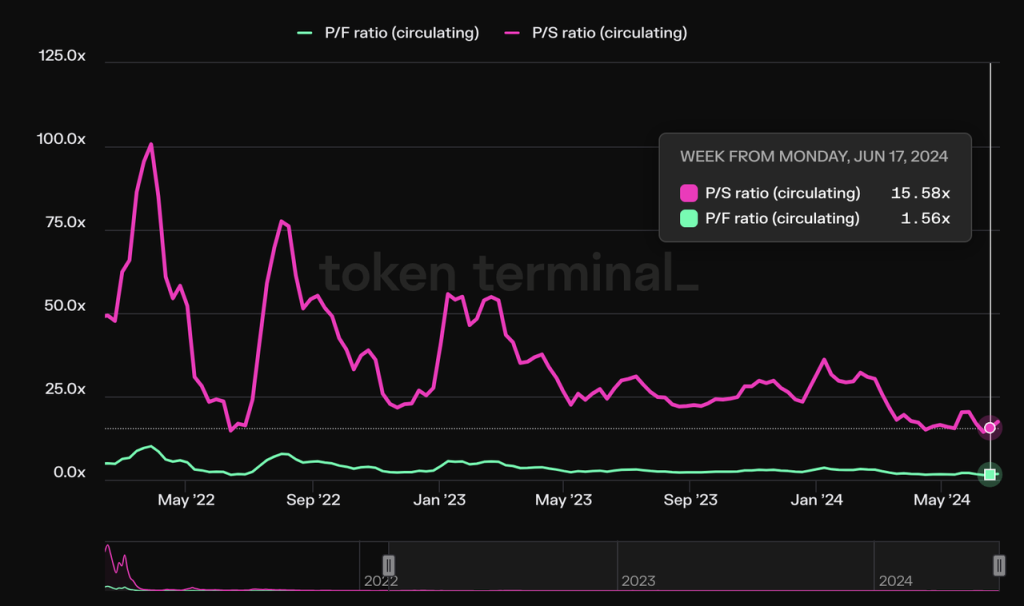
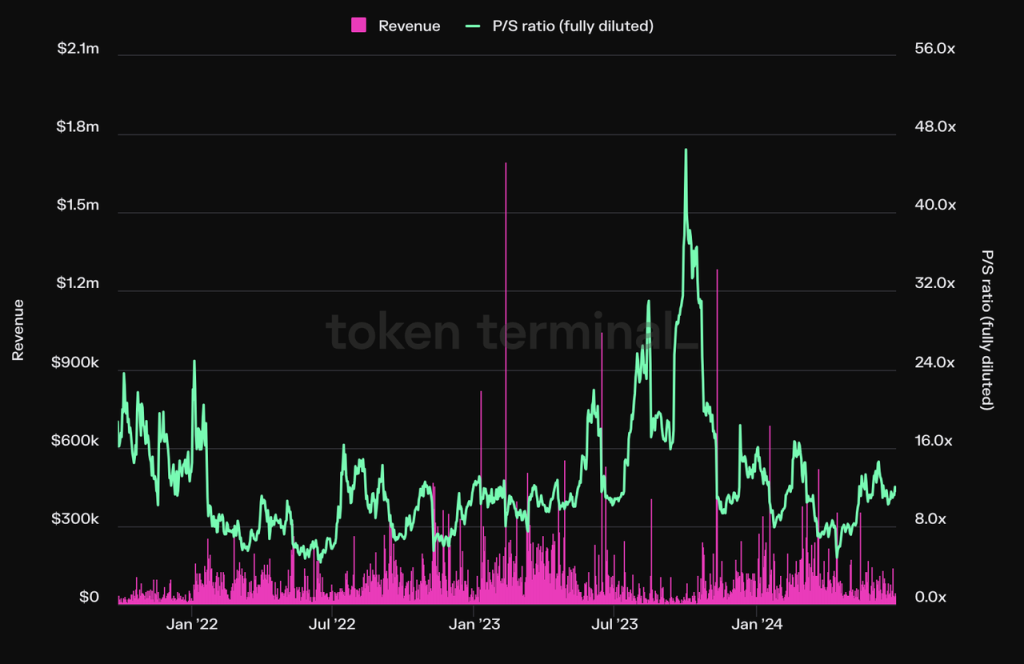
Take the lending protocol Aave as an example. While its quarterly revenues (referring to net income, not overall agreement fees) have surpassed the highs of the last cycle and hit all-time highs, its PS ratio (circulating market cap/annualized revenue) has hit an all-time low and is currently at just 17.4x.
- Regulation: The FIT21 Act is favorable for DeFi compliance and may trigger potential M&A
FIT21, the Financial Innovation and Technology for the 21st Century Act, aims to establish a clear federal regulatory framework for the digital asset market, enhance consumer protection, and promote U.S. leadership in the global digital asset market. Proposed in May 2023 and passed by a wide margin in the House of Representatives on May 22 of this year, this Act clarifies the regulatory framework and rules for market participants. Once officially passed, it will facilitate investment in DeFi projects for both startups and traditional financial entities. Given traditional financial institutions like BlackRock’s recent embrace of crypto assets, such as promoting ETF listings and issuing bond assets on Ethereum, DeFi is likely to be a major focus area for them in the coming years. For traditional financial giants, mergers and acquisitions could be one of the most convenient options, and any sign of relevance, even mere acquisition intentions, will trigger a Defi leading project’s revaluation.
I will analyze the business conditions, competitive advantages, and valuations of selected DeFi projects as the examples.
Given the multitude of DeFi projects, I will prioritize those with better business development, significant competitive advantages, and more attractive valuations.
Notable DeFi Projects
Lending Protocol: Aave
Aave stands out as one of the most established DeFi projects, having secured its initial funding round in 2017. Post-funding, Aave evolved from a peer-to-peer lending framework (formerly known as Lend) to a sophisticated peer-to-pool model. During the previous bull market, Aave outperformed Compound, a major competitor in its space, and now leads the lending protocols in both market share and market cap
The core business model of Aave revolves around capturing the spread between borrowing and lending rates. In 2023, Aave introduced its stablecoin, $GHO, which is designed to bolster its interest income. Managing GHO, however, means additional operational costs including marketing and liquidity incentives.
Business Overview
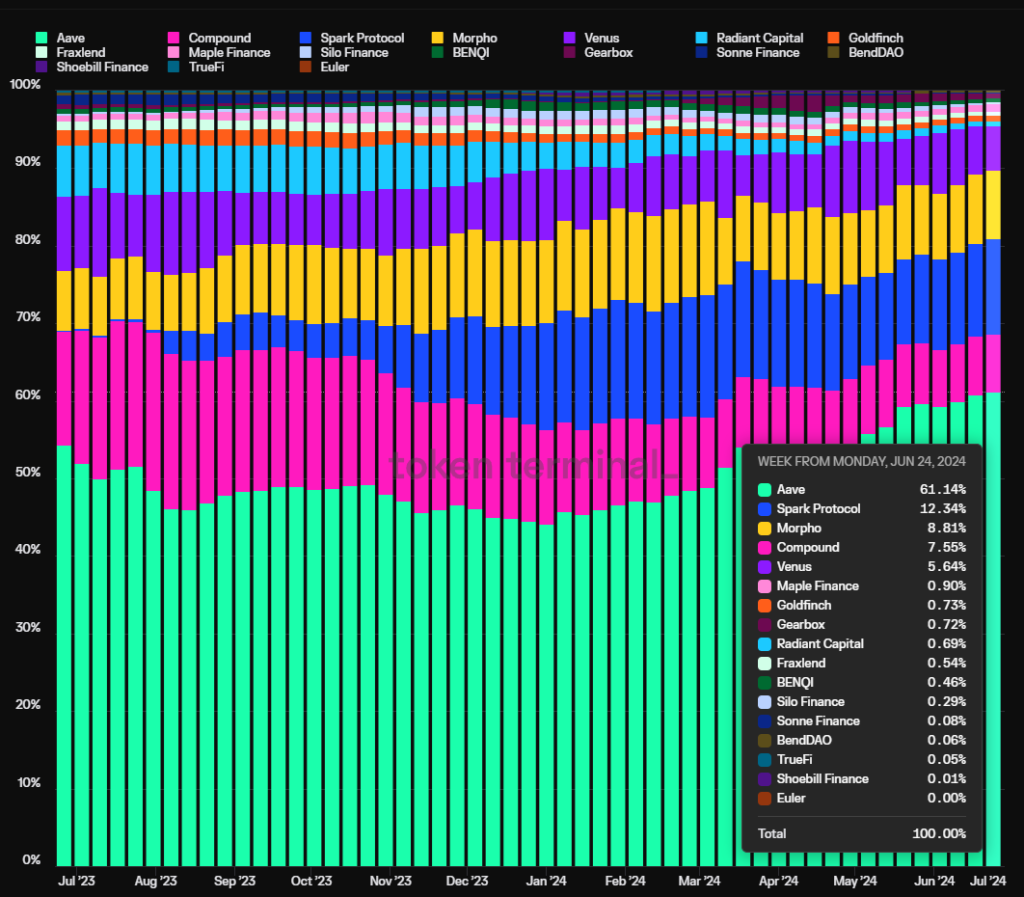
For lending protocols, the active loan volume is a pivotal indicator, serving as the primary revenue stream for such projects.
The chart below illustrates Aave’s market share in terms of active loan sizes over the last year. Aave’s proportion of active loans has been on an upward trajectory for the past six months, now claiming a significant 61.1% market share. It’s important to note that this percentage might be understated. The graph inadvertently includes a double count of the loan volumes attributed to Morpho’s optimizers which operate on both Aave and Compound.
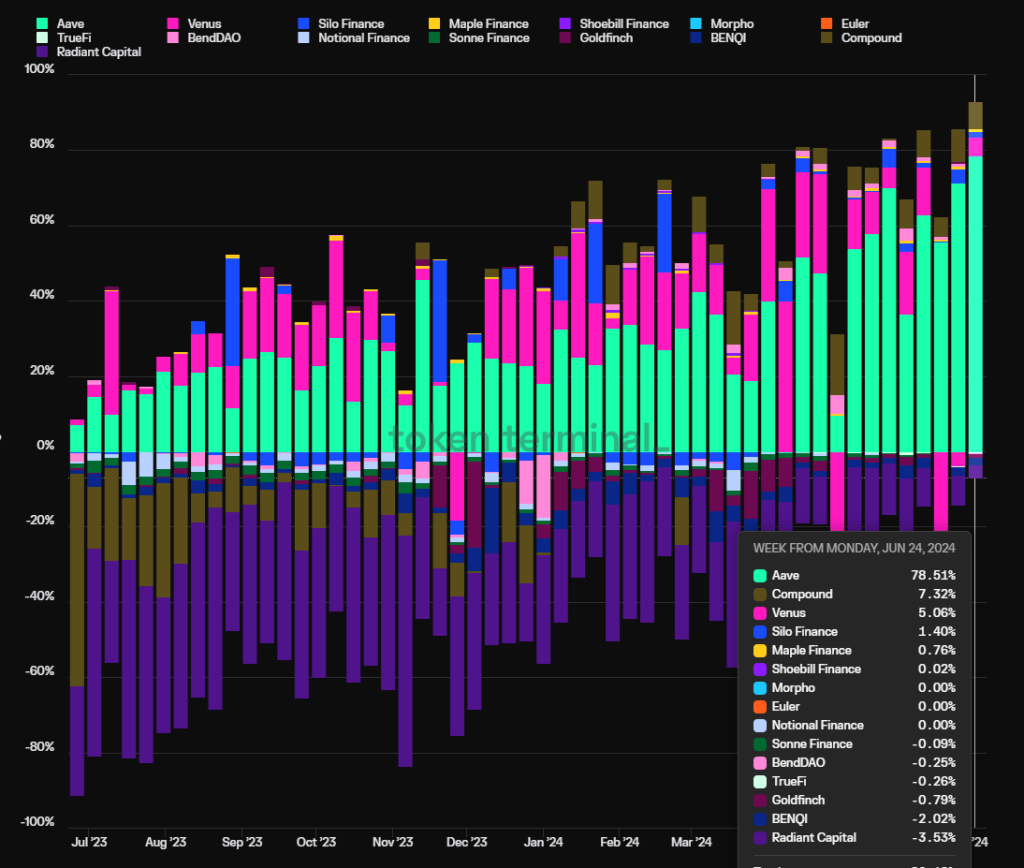
Another vital metric is the protocol’s profitability or its profit margins. Here, profits are calculated as the protocol’s revenue minus token incentives. As illustrated in the subsequent graph, Aave’s protocol profitability has distanced itself from other lending protocols. Aave effectively abandoned the Ponzi model of relying on token subsidies to fuel operations, a strategy still employed by others such as Radiant (indicated by the purple segment in the chart).
Competitive Advantages
Aave has four foundational strengths:
1. Ongoing Accumulation of Security Credit: Many new lending protocols face security breaches within their first year of operation. However, Aave has maintained a flawless record with no incidents at the smart contract level since its inception. This track record of safe and stable operations is a crucial factor for DeFi users when selecting a lending platform, particularly for high-volume investors or “whales.” Justin Sun, for instance, is a notable long-term user of Aave.
2. Bilateral Network Effect: Similar to many online platforms, DeFi lending operates as a classic bilateral market where depositors and borrowers form the respective sides of supply and demand. An increase in activity on one side—whether in deposits or loans—naturally boosts activity on the other, setting a high barrier for new entrants. Moreover, the greater the overall liquidity of the platform, the smoother the transitions for both deposits and withdrawals become, and the more likely to be favored by whales, which in turn stimulates the growth of the platform business.
3. Exceptional DAO Governance: Aave has transitioned to a fully decentralized DAO-based governance system, providing greater transparency and deeper community engagement in decision-making compared to centralized management. The Aave DAO boasts a vibrant ecosystem of governance participants, including top venture capitalists, university blockchain clubs, market makers, risk management firms, third-party developers, and financial advisors. These participants are diverse and actively engaged in governance. From the operational results of the project, Aave, as a latecomer to peer-to-peer lending services, has managed to balance growth and security effectively in product development and asset expansion and realized its overtaking of the industry leader Compound. The DAO governance has played a crucial role in this process.
4. Strategic Positioning in the Multi-Chain Ecosystem: Aave has established a strong presence across nearly all EVM-compatible Layer 1 and Layer 2 networks, consistently ranking at the top in terms of Total Value Locked (TVL) on each. The upcoming Aave V4 will enhance multi-chain liquidity integration, amplifying the benefits of cross-chain liquidity flows. The following chart provides more details.
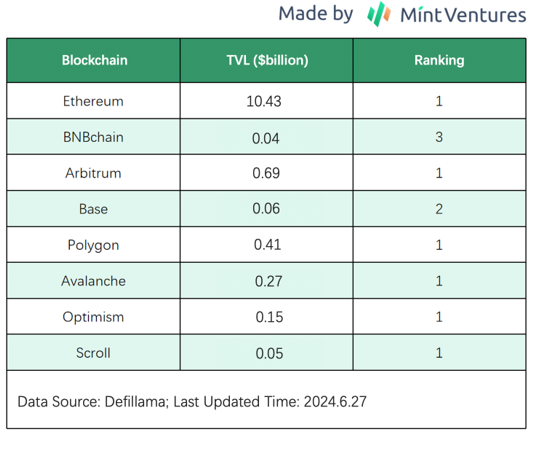
In addition to EVM-compatible chains, Aave is actively assessing other networks like Solana and Aptos, considering potential deployments on these networks in the future.
Valuation Insights
As per Tokenterminal data, Aave has seen its valuation metrics dip to historical lows due to a steady increase in protocol fees and revenues, along with a persistently low token price. The Price to Sales (PS) ratio, which compares the circulating market cap with protocol revenue, stands at 17.44x, while the Price to Fees (PF) ratio, comparing market cap to protocol fees, is at 3.1x.
Risks and Challenges
Although Aave has been successfully expanding its share in the lending market, it faces emerging competition from Morpho Blue, a noteworthy modular lending platform. Morpho Blue offers a flexible suite of modular protocols to third parties aiming to establish their own lending markets. This platform allows for the customization of collaterals, borrowing assets, oracles, and risk parameters, enabling the creation of tailored lending environments.
This modular approach has facilitated the entry of numerous new players into the lending space, who have begun to offer lending services. For instance, Gauntlet, previously a risk manager for Aave, opted to sever ties with Aave in favor of launching its own lending market on Morpho Blue.
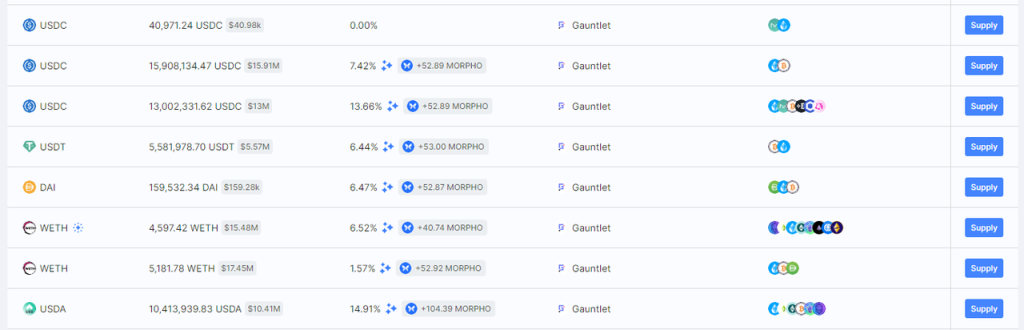
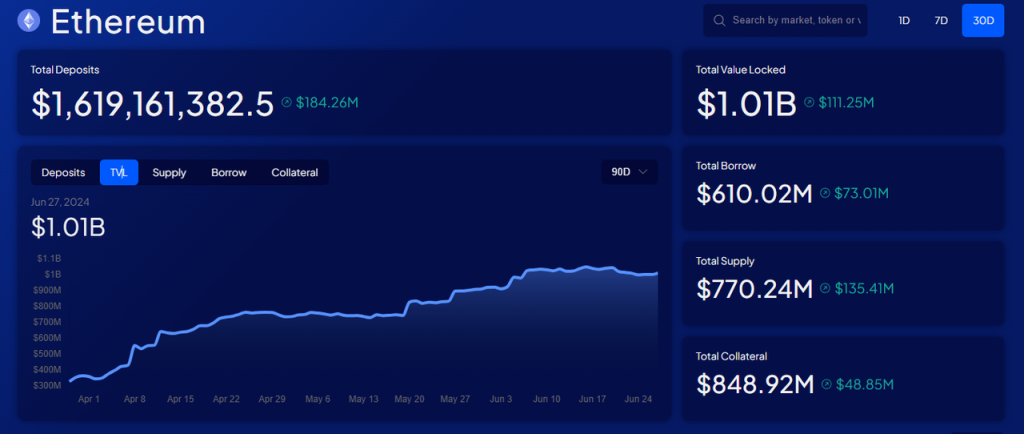
Since its launch more than half a year ago, Morpho Blue has experienced rapid growth, now ranking as the fourth-largest lending platform by TVL, just behind Aave, Spark (a MakerDAO-launched copy of Aave v3), and Compound.
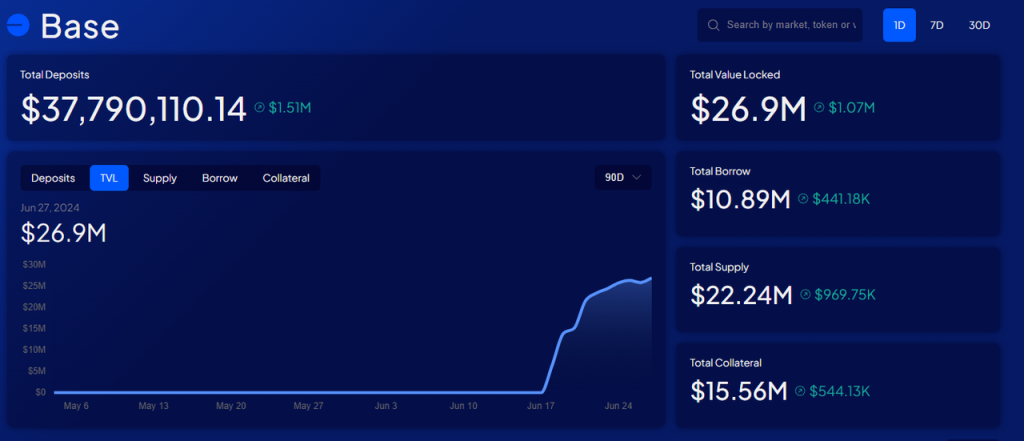
Its expansion on Base has been particularly swift, achieving a TVL of $27 million in less than two months, while Aave’s TVL on Base stands at approximately $59 million.
Decentralized Exchanges: Uniswap & Raydium
Uniswap and Raydium are key players within the Ethereum EVM and Solana ecosystems, respectively. Uniswap debuted on the Ethereum mainnet with its V1 version in 2018, but it was the introduction of its V2 in May 2020 that catapulted the platform to prominence. Raydium, on the other hand, made its entry on the Solana network in 2021.
The rationale behind highlighting two distinct entities in the decentralized exchanges sector is their affiliation with the two most populous Web3 ecosystems: the EVM ecosystem, centered around Ethereum—the leading public blockchain—and the fast-expanding Solana ecosystem. Both projects boast unique advantages and face specific challenges. Let’s delve into a detailed analysis of each.
Uniswap
Business Overview
Since its V2 release, Uniswap has maintained its position as the leading decentralized exchange (DEXs) in terms of trading volume across the Ethereum mainnet and other EVM-compatible chains. We focus primarily on two key metrics: trading volume and trading fees.
The chart below illustrates the monthly trading volume share of Uniswap V2 from its launch, excluding trading volumes on non-EVM chains:
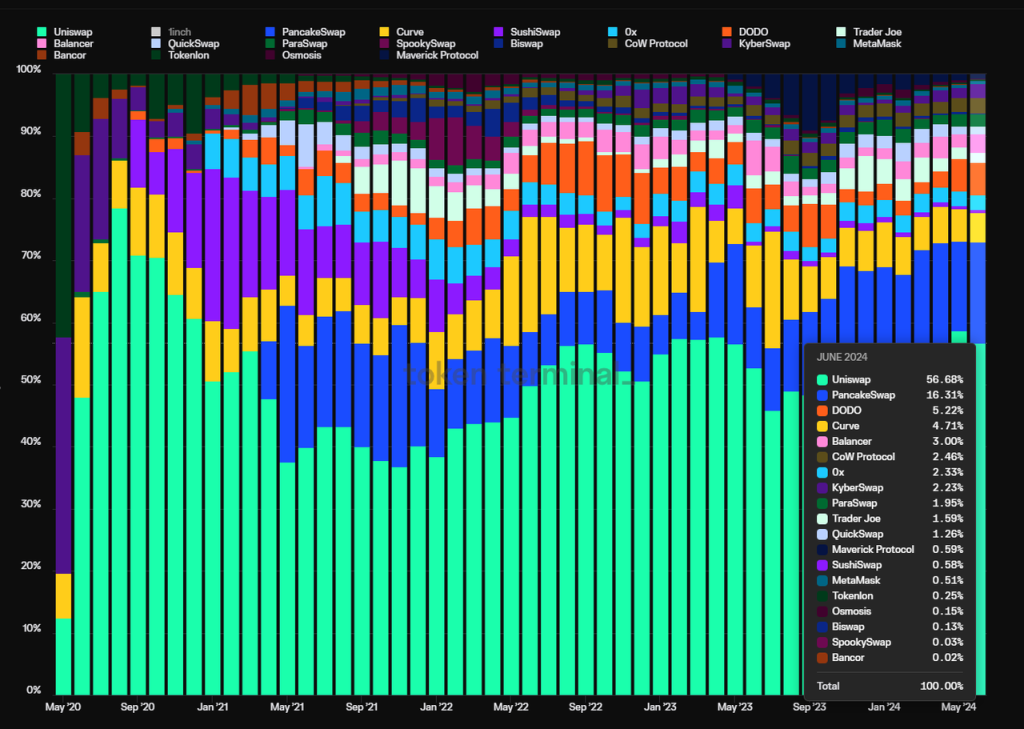
From the launch of its V2 in May 2020, Uniswap’s market share reached a peak of 78.4% in August 2020 and then declined to a bottom of 36.8% during the most fierce DEX wars in November 2021. It has since rebounded to a stable 56.7%, evidencing its ability to withstand tough competition.
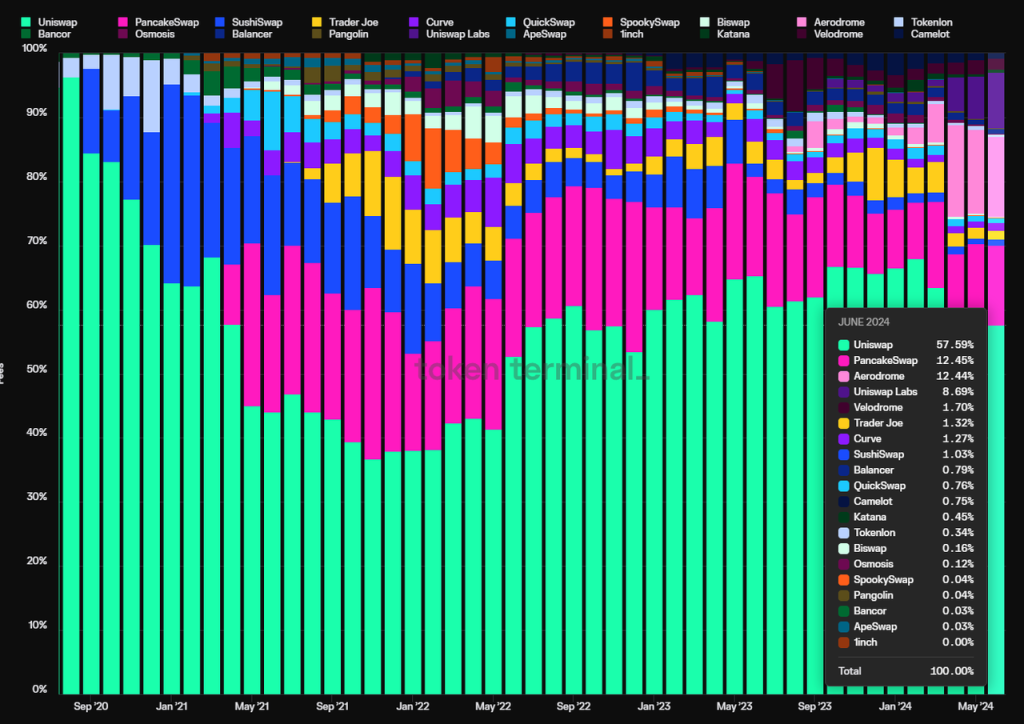
This trend is also mirrored in its share of trading fees; after bottoming out at 36.7% in November 2021, Uniswap’s market share in fees has steadily climbed, now standing at 57.6%.
Remarkably, Uniswap has largely refrained from subsidizing liquidity with tokens, except for brief periods in 2020 on the Ethereum mainnet and at the end of 2022 on the Optimism mainnet. This restraint stands in stark contrast to most other DEXs, which continue to rely on liquidity incentives to this day.
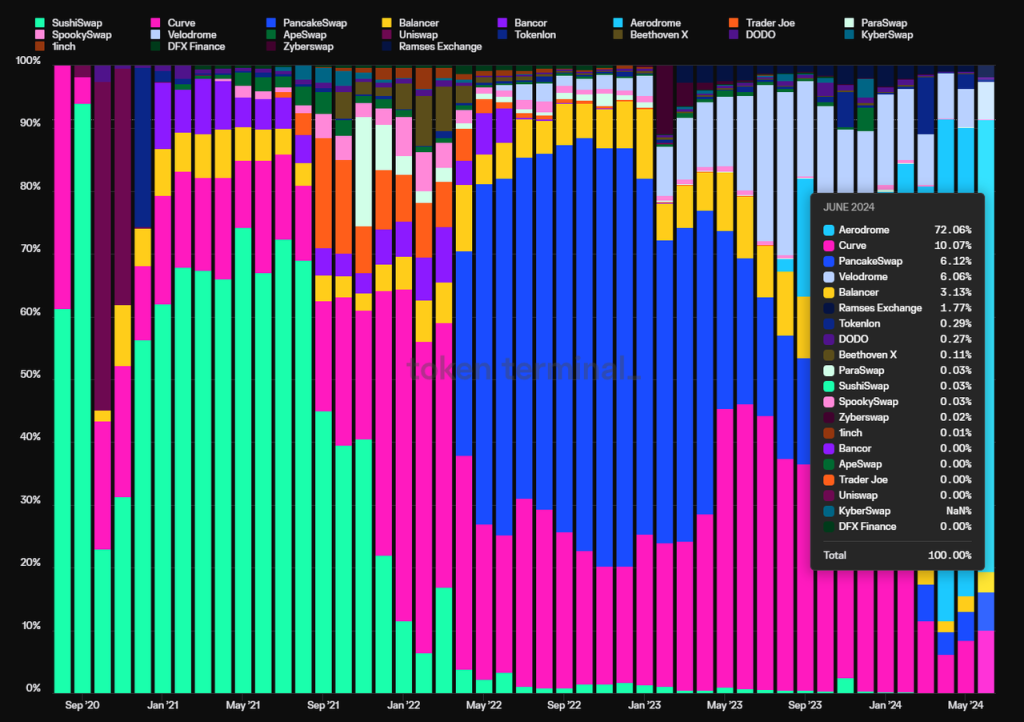
The chart below illustrates the monthly incentives of major DEXs. It can be observed that Sushiswap, Curve, Pancakeswap, and Aerodrome, a project adopts ve(3,3) model and built on Base, all of which at one point had the largest subsidy amounts. However, none of them have managed to secure a higher market share than Uniswap.
One persistent critique of Uniswap is that despite not engaging in token incentives, its tokens still lack utility, as the protocol has not activated $UNI as gas fee.
In late February 2024, Erin Koen, a Uniswap developer and governance lead in Uniswap foundation, submitted a proposal to upgrade the protocol. This would introduce a fee structure to benefit $UNI holders who have approved and delegated their tokens, leading to significant community debate. Although the vote was initially planned for May 31, it has been postponed and remains pending. Despite these delays, Uniswap has taken initial steps toward enabling fees and enhancing the utility of $UNI tokens, with the revised contract already developed and audited. Uniswap will have a separate revenue stream from the protocol in the near future.
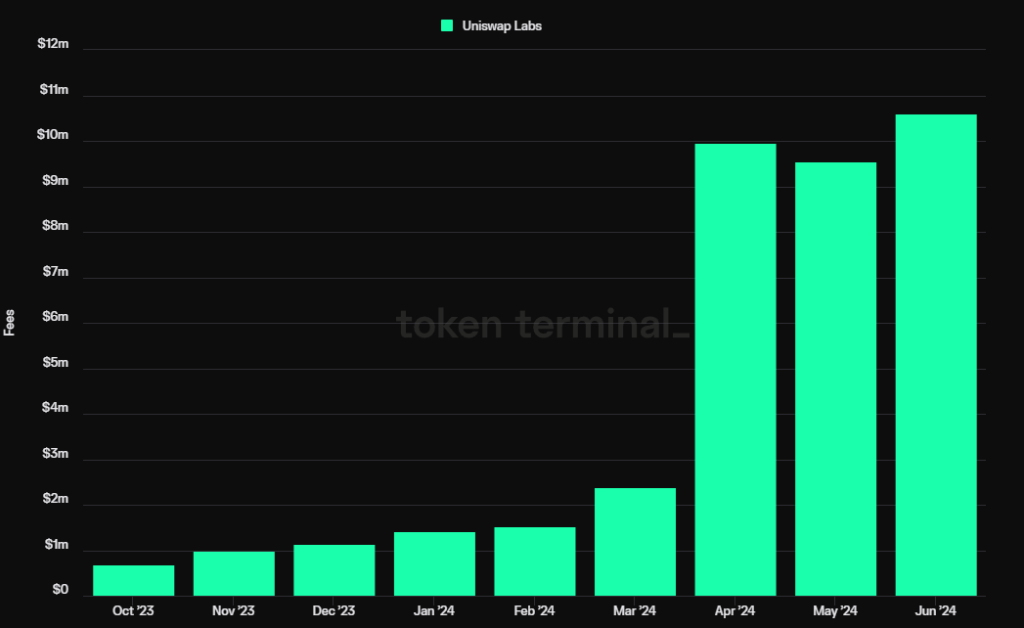
Additionally, Uniswap Labs started implementing a swap fee in October 2023 for users trading through the official Uniswap website and the Uniswap wallet. The fee is set at 0.15% and involving ETH, USDC, WETH, USDT, DAI, WBTC, agEUR, GUSD, LUSD, EUROC, and XSGD. However, it is important to note that swap between stablecoins and wraps between ETH and WETH are excluded from this fee.
Simply initiating a fee structure on Uniswap’s interface has positioned Uniswap Labs as one of the highest revenue-generating teams within the Web3 space.
With the anticipated activation of protocol layer fees and based on the annualized fees from the first half of 2024, Uniswap could generate around $1.13 billion annually. If the protocol charges a 10% fee ratio, this would translate to an annual protocol revenue of approximately $113 million.
Additionally, the expected launches of Uniswap X and V4 later this year are set to potentially boost its market share in trading volumes and fees even further.
Competitive Advantages
The competitiveness of Uniswap are underpined by the three key factors:
1. Reputation Among Users: There was considerable skepticism when Uniswap first implemented interface fees last year. Many thought users would swiftly migrate their swaps to aggregators like 1inch to avoid extra fees. Contrary to these expectations, interface fee revenue continued to grow and even outpaced Uniswap’s fee growth for the entire protocol.
This data is a strong indication proving the power of user habits on Uniswap. Many users are not caring about this 0.15% fee expense and choosing to stick with their familiar trading routines.
2. Bilateral Network Effect: Uniswap functions as a classic two-sided market. On one side are the traders, and on the other, the liquidity providers (LPs). The more vibrant the trading at a given platform, the more it attracts LPs to offer liquidity, creating a cycle of mutual reinforcement. The other dimension of this bilateral effect involves the traders and the teams deploying initial token liquidity. To ensure their tokens are easily discoverable and tradable, these teams often prefer to establish initial liquidity on well-known DEXs like Uniswap rather than on lesser-known, smaller platforms. This strategy not only enhances the visibility of new tokens but also reinforces trader habits to first seek out Uniswap for new investments, thereby strengthening the two-sided market dynamic between “blockchain projects” and “traders.”
3. Multi-Chain Deployment: Like Aave, Uniswap has been actively expanding its presence across multiple blockchain networks. It is visible on all major EVM chains, consistently ranking among the top decentralized exchanges in terms of trading volume on those networks.
With the upcoming introduction of Uniswap X, which will enhance support for tradings across different chains, Uniswap’s competitive edge in multi-chain liquidity is poised to grow even stronger.
Valuation Insights
The primary measure for assessing Uniswap’s value is the Price to Fees (PF) ratio, which compares its circulating market cap to its annualized fees. Presently, $UNI tokens are valued within a historically high percentile, likely influenced by market anticipation of the upcoming fee switch upgrade.
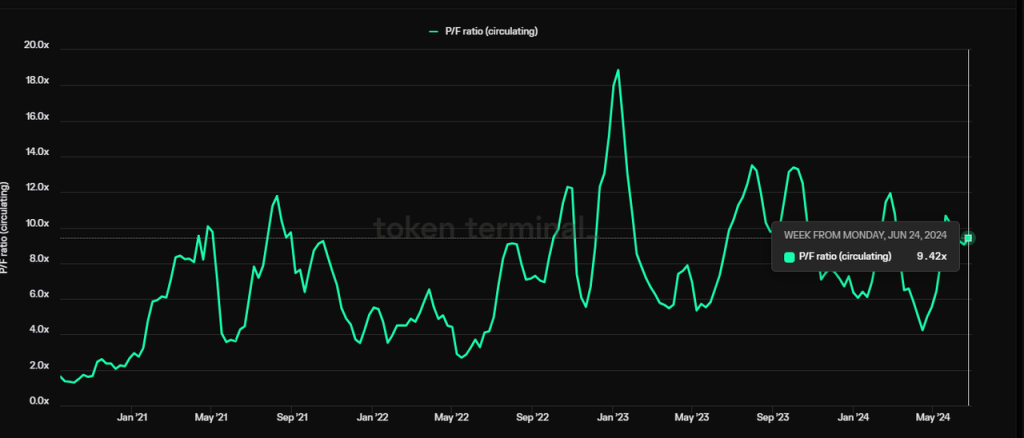
As for market valuation, Uniswap currently boasts a circulating market cap of nearly $6 billion and a fully diluted valuation of approximately $9.3 billion, indicating a reasonable valuation.
Risks and Challenges
Regulatory Risk: In April 2024, Uniswap was served a Wells Notice by the SEC, signaling potential forthcoming enforcement actions. While the progressive advancement of the FIT21 bill may eventually offer DeFi projects like Uniswap a clearer and more predictable regulatory framework, but given that it will still take a long time for the bill to be voted on and put into place, and the lawsuit from the SEC will put pressure on Uniswap’s operational activities and token prices in the medium term.
Position in DeFi Ecosystem: DEXs are the fundamental layer of liquidity. Traditionally, the upstream entities above DEXs are aggregators (e.g., 1inch, Cowswap, Paraswap), which offer users comparative pricing across chains to identify optimal trading routes. This model to a certain extent inhibit the downstream DEX of the user trading behavior of the charges and pricing ability. With the development of blockchain, wallets with built-in trading functions have emerged as higher-level infrastructure. With the adoption of ‘intent-based’ models, DEXs are expected to serve as invisible sources of liquidity, possibly diminishing the direct use of platforms like Uniswap in favor of a comprehensive “comparison shopping mode.” Aware of these dynamics, Uniswap is making concerted efforts to ascend within the ecosystem, notably through promoting its own wallet and launching Uniswap X to become more aggregated, aiming to enhance its strategic positioning.
Raydium
Business Overview
We will closely analyze Raydium’s trading volume and fees. Raydium has a significant advantage over Uniswap due to its early implementation of protocol fees, resulting in robust cash flows. Consequently, Raydium’s protocol revenue will also be a major focus of our analysis.
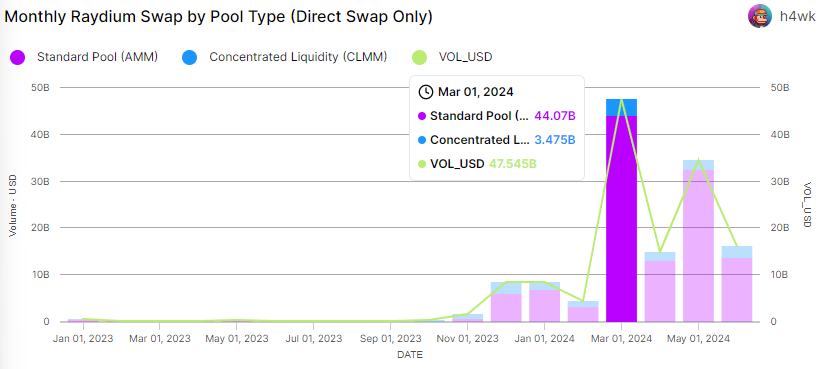
Reviewing Raydium’s trading volume, which have surged since October 2023 due to the thriving Solana ecosystem, we see a peak in March when volume reached $47.5 billion—about 52.7% of Uniswap’s trading volume for the same month.
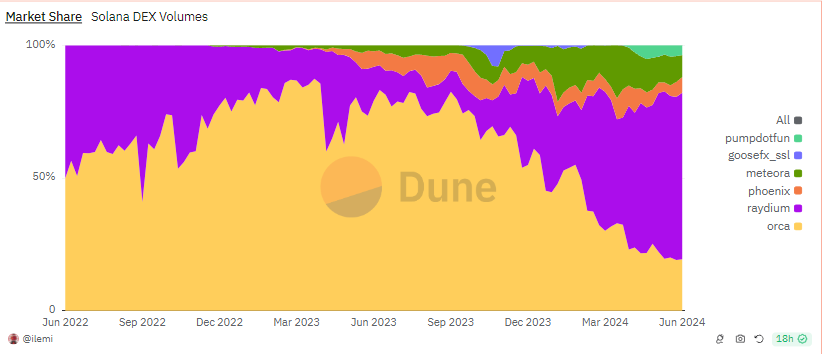
In terms of market share, Raydium’s trading volume on the Solana has consistently increased since September 2023 and now represents 62.8% of all trading volume within the Solana ecosystem. Raydium’s dominance in Solana even exceeds Uniswap’s influence within the Ethereum ecosystem.
Raydium’s impressive ascent in market share, rising from less than 10% during a slump to over 60%, can largely be attributed to the sustained Meme hype in this bull cycle. Raydium utilizes two types of liquidity pools: standard AMMs and CPMMs. The standard AMM model, similar to Uniswap V2, features evenly distributed liquidity suitable for assets with high volatility. In contrast, the CPMM model, akin to Uniswap V3, allows liquidity providers to set specific ranges for their liquidity, resulting in a system that is more flexible yet more complex.
Raydium’s competitor, Orca, opts for a concentrated liquidity pool model similar to Uniswap V3, but Raydium’s standard AMM model proves more conducive for memecoins who need to provide and allocate liquidity in large volumes every day. This has made Raydium the go-to liquidity platform for memecoins.
Additionally, Solana has become the leading incubator for memecoins during this bull market, witnessing the creation of thousands of new memecoins each day since November. These memecoins have become the driving force behind the thriving Solana ecosystem, significantly boosting Raydium’s business expansion.
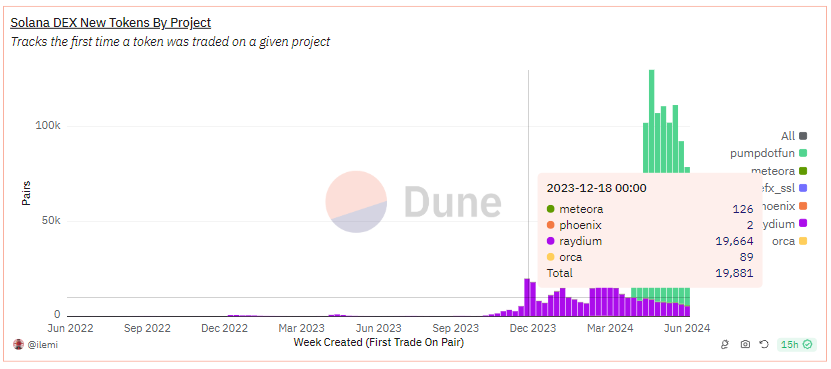
As indicated by the chart, in December 2023, Raydium introduced 19,664 new tokens within a week, in stark contrast to 89 new tokens on Orca. Theoretically, Orca’s concentrated liquidity mechanism could emulate traditional AMMs by setting liquidity to span “the full range.” However, this method lacks the simplicity of Raydium’s standard pool model.
This is further evidenced by Raydium’s trading data, which shows that 94.3% of its trading volume stems from standard pools, largely driven by memecoins.
Additionally, Raydium operates as a bilateral market similar to Uniswap, catering to both projects and individual users. The more retail traders on Raydium encourages memecoins to establish their initial liquidity on the platform. This dynamic spurs users and user-support tools (like various memecoin-tracking bots on telegram) to conduct their trading through Raydium, establishing a self-perpetuating cycle that significantly extends Raydium’s lead over Orca.
Regarding swap fees, Raydium accrued about $300 million in the first half of 2024, which is 9.3 times the fees it collected throughout all of 2023.
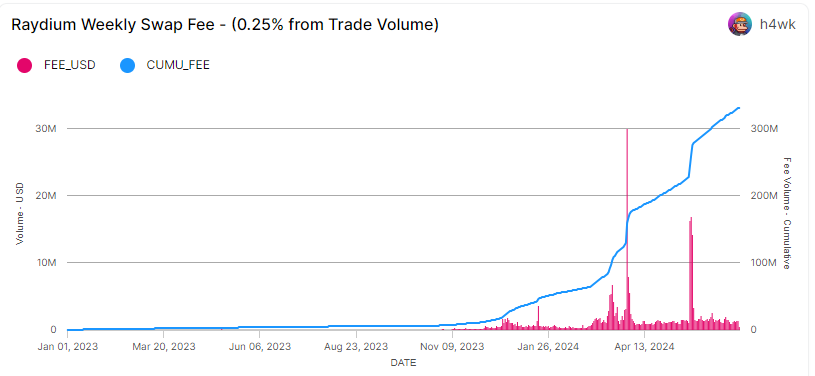
Raydium’s standard AMM pools charge a swap fee of 0.25%, with 0.22% of that fee distributed to liquidity providers (LPs), and the remaining 0.03% allocated for the buyback of $Ray, the native token of Raydium. In the CPMM pools, the fee ratio are customizable and can be freely set at 1%, 0.25%, 0.05%, or 0.01%, with the LP receiving 84% of the trading fees and the remaining 16% is split between buying back Ray tokens (12%) and contributing to the treasury (4%).
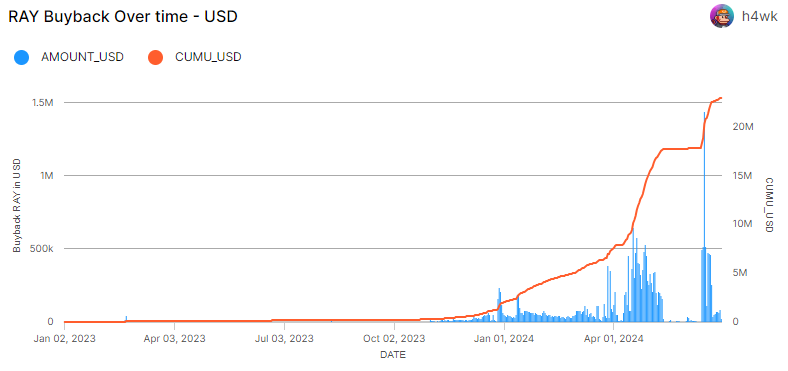
In the first half of 2024, Raydium used about $20.98 million of its protocol revenue to buy back $Ray tokens, an amount 10.5 times the total spent on buybacks in 2023.
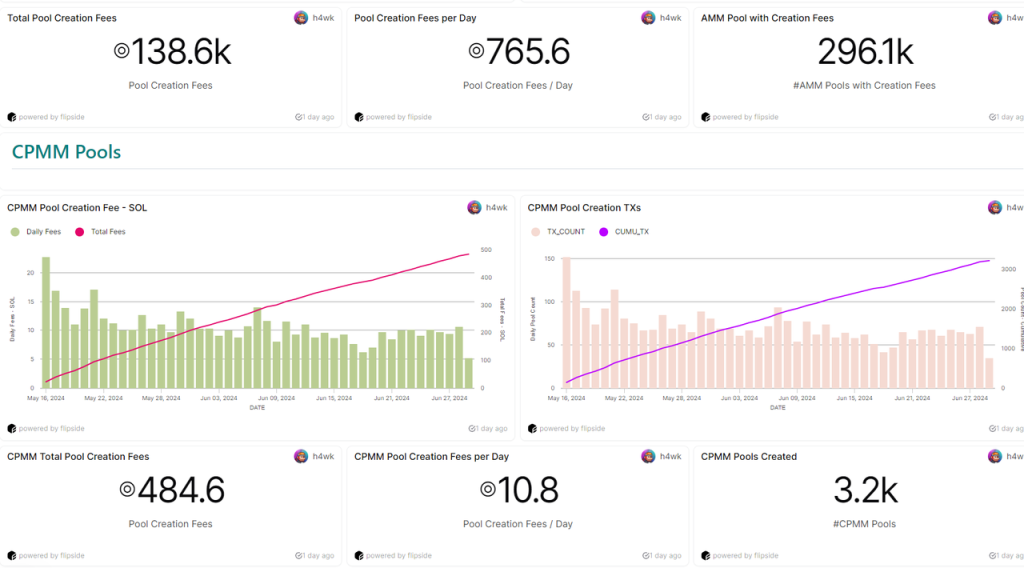
Besides trading fees, Raydium charges for creating new pools: 0.4 SOL for a standard AMM pool and 0.15 SOL for a CPMM pool. Raydium’s daily earnings from these pool creation fees average around 775 SOL. Calculated at the $SOL on June 30th, 2024, the total revenue should be $108,000. These funds are directed towards protocol development and maintenance, serving as operational income for the team, rather than being deposited into the treasury or used for $Ray buybacks.
Similar to most decentralized exchanges, Raydium continues to offer incentives for liquidity providing. While there is no data available for the amounts of these incentives, one can estimate the current value of the incentives being provided to active liquidity pools by analyzing the data available on Raydium’s official liquidity interface.
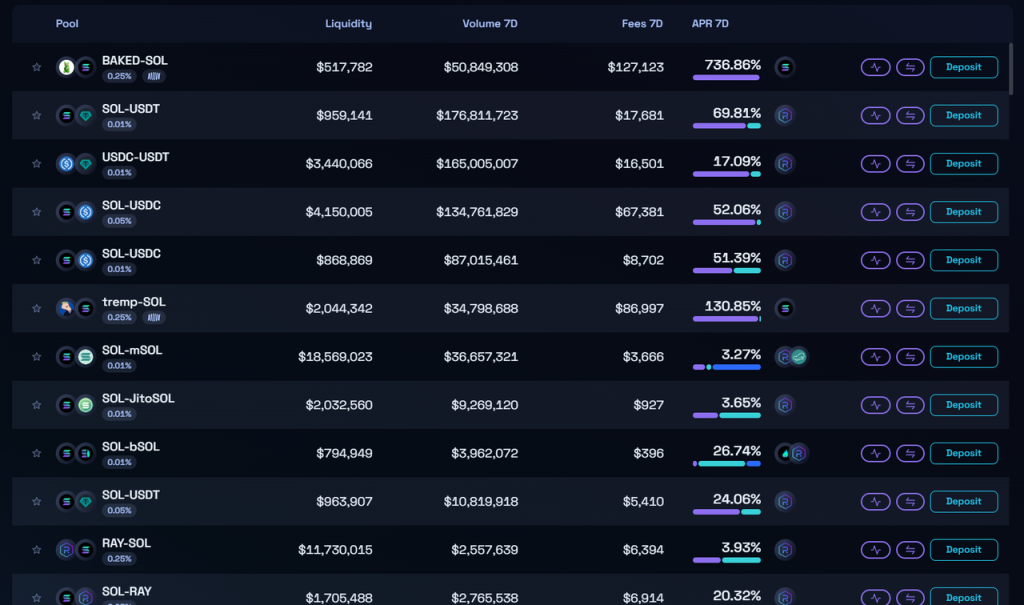
Based on current Raydium incentives for liquidity, there is roughly $48,000 worth of incentive spending per week, primarily in Ray tokens. This expenditure is considerably lower than the protocol’s weekly revenue, which nears $800,000 (not including revenue from creating pools). This disparity underscores that Raydium is operating with a positive cash flow.
Competitive Advantages
Raydium holds the distinction of being the DEXs with the highest market trading volume on Solana. Its primary strength lies in the bilateral network effects. Same as Uniswap, these effects are amplified by the symbiotic relationships between traders and liquidity providers, as well as between project initiators and traders. The impact of these network effects is especially significant within memecoins.
Valuation Insights
Due to the lack of historical data before 2023, the valuation is based on a comparison between Raydium’s valuation data from the first half of 2024 and the full year of 2023.
With the spike in trading volume this year, despite a rise in the price of Ray tokens, Raydium’s valuation relative to last year has noticeably declined. Furthermore, when compared to other DEXs such as Uniswap, Raydium’s Price to Fees (PF) ratio is still relatively low.
Risks and Challenges
Although Raydium has demonstrated robust growth in trading volume and revenue in the past half year, its future development is fraught with uncertainties and challenges.
Ecosystem Position: Raydium struggles with its positioning within the ecosystem. In the Solana ecosystem, aggregators such as Jupiter wield greater influence, with their trading volumes significantly outstripping those of Raydium. In June 2024, Jupiter’s total trading volume in was $28.2 billion, compared to Raydium’s $16.8 billion. Moreover, memecoin-focused platforms like Pump.fun are gradually overtaking Raydium as the go-to launchpad for projects, with more memecoins choosing to launch via Pump.fun instead of Raydium, despite their ongoing collaboration. Pump.fun is increasingly diminishing Raydium’s influence among projects, and Jupiter has overtaken Raydium in capturing trader engagement. Should this trend continue unaddressed, and should top-tier entities like Pump.fun or Jupiter develop their own DEXs or pivot to competitors, Raydium could face significant challenges.
Shifts in Market Trends: Before the memecoin craze swept through Solana, Orca’s share of trading volume was seven times larger than that of Raydium. This cycle, due to Raydium’s standard pools being more friendly to memecoins, Raydium managed to recapture some of its lost market share. Yet, the longevity of the memecoin craze within Solana remains uncertain, as does the future dominance of memecoins on the blockchain. Predicting these trends is challenging. Should the market’s preference for types of crypto assets shift, Raydium’s regained market share could be at risk once again.
Token Emission: The circulating ratio of $RAY is 47.2%, relatively low when benchmarked against other DeFi projects. This could mean potential downward pressure on prices as more tokens become unlocked. However, given Raydium’s robust cash flow, selling off these tokens isn’t the sole strategy available. The team could opt to burn the yet-to-be-released tokens, a move that could help mitigate worries about oversupply.
Centralization Concerns: Raydium has not initiated a governance system driven by $RAY tokens, leaving the project’s evolution solely in the hands of the core team. This centralization may hinder the distribution of profits that should be attributed to the holders. For instance, decisions on the allocation of buybakced $RAY have yet to be clarified, leaving a critical issue pending.
Staking: Lido
Lido is the leading liquidity staking within the Ethereum ecosystem. The Beacon Chain’s initiation at the close of 2020 signaled Ethereum’s transition from Proof of Work (PoW) to Proof of Stake (PoS). Initially, the absence of a withdrawal feature for staked assets resulted in a loss of liquidity for staked ETH. Notably, it was not until the Shapella upgrade in April 2023 that withdrawals from the Beacon Chain were enabled, leaving early ETH stakers without liquidity for over two and a half years.
Lido was the first to introduce the liquidity staking concept. When users deposit ETH into Lido, they will receive stETH as proof of their stake. Lido facilitated a robust stETH-ETH liquidity pool on Curve, marking the first time users could reliably participate in ETH staking to earn rewards while retaining the flexibility to withdraw their ETH at any time. This breakthrough fueled rapid growth, establishing Lido as the frontrunner in Ethereum’s staking landscape.
Regarding its business model, Lido retains 10% of the staking revenue it generates, allocating 5% to staking service providers and managing the remaining 5% through its DAO.
Business Overview
Lido’s primary operation revolves around providing ETH liquidity staking services. In the past, Lido held the position of the top liquidity staking provider on the Terra network and was the second-largest on the Solana network. It also ventured into expanding its services across other blockchains, including Cosmos and Polygon. Nevertheless, Lido prudently scaled back its operations, choosing to concentrate exclusively on Ethereum network staking. Today, Lido stands as the market leader in ETH staking and boasts the highest TVL among all DeFi protocols.
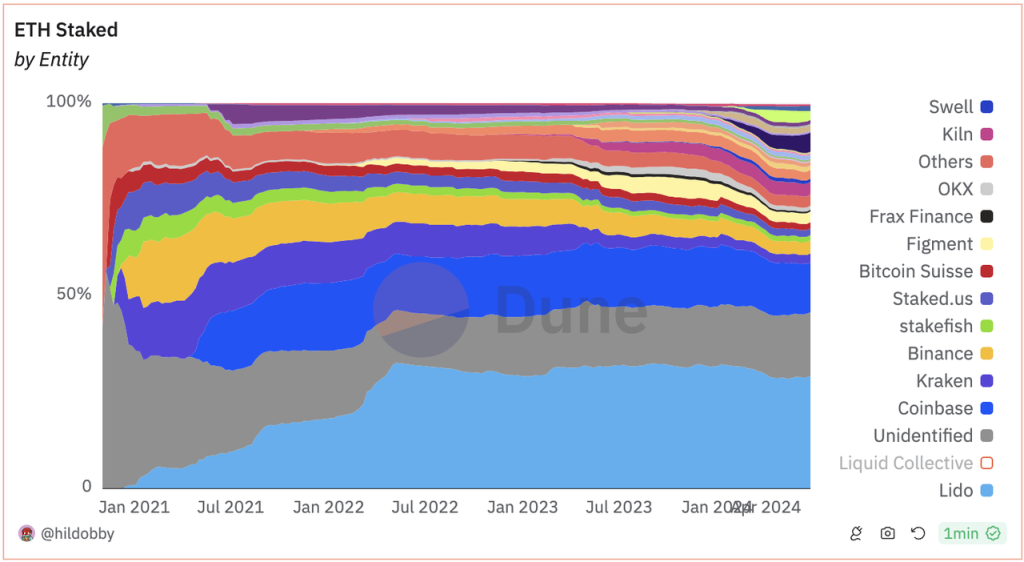
With the substantial stETH-ETH liquidity created by extensive $LDO incentives, and with investment support from institutions like Paradigm and Dragonfly in April 2021, Lido surpassed its main competitors—centralized exchanges such as Kraken and Coinbase—by the end of 2021, positioning itself at the forefront of the Ethereum staking landscape.
However, this led to concerns about whether Lido’s prominent position could undermine Ethereum’s decentralization. The Ethereum Foundation is considering measures to cap any single entity’s staking share at 33.3% to preserve the network’s decentralized nature. After hitting a high of 32.6% in May 2022, Lido’s market share has oscillated between 28% and 32%.
Competitive Advantages
Lido’s business strength consists of two main points:
- Lido’s enduring leadership in the market has cultivated stable expectations, positioning it as the go-to platform for whales and institutions interested in ETH staking. Notable figures like Justin Sun, and Mantle before launching their LST, and many big investors are among Lido’s clientele.
- Network effects from a wide range of stETH use cases. stETH was fully supported by the head DeFi protocol as early as 2022. And subsequently, DeFi protocols have developed and found ways to integrate with stETH, evidenced by the traction gained by projects like LSTfi in 2023, and others such as Pendle and various LRT initiatives. This extensive adoption has solidified stETH’s role as a foundational yield-generating asset within the Ethereum network.
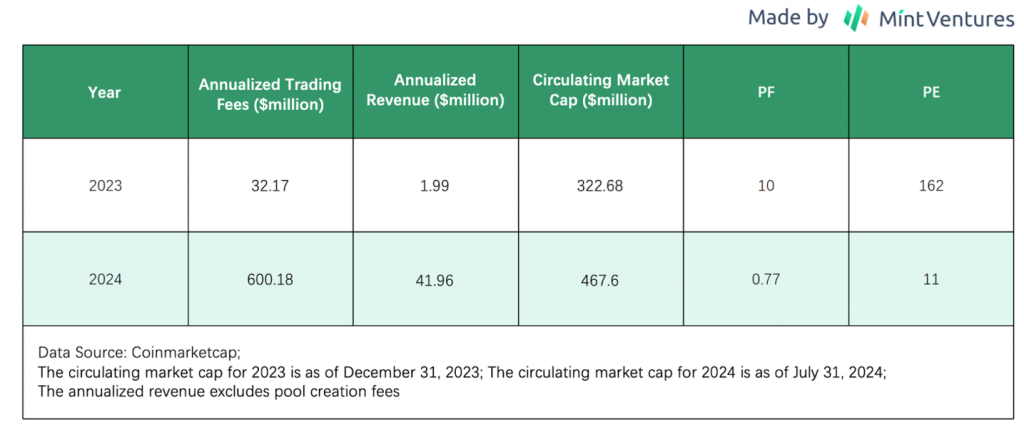
Valuation Insights
Despite a modest dip in market share, Lido’s staking volume has continued to expand, propelled by an increasing overall staking rate of $ETH. Valuation-wise, Lido’s Price to Sales (PS) and Price to Fees (PF) ratios have recently hit all-time lows.
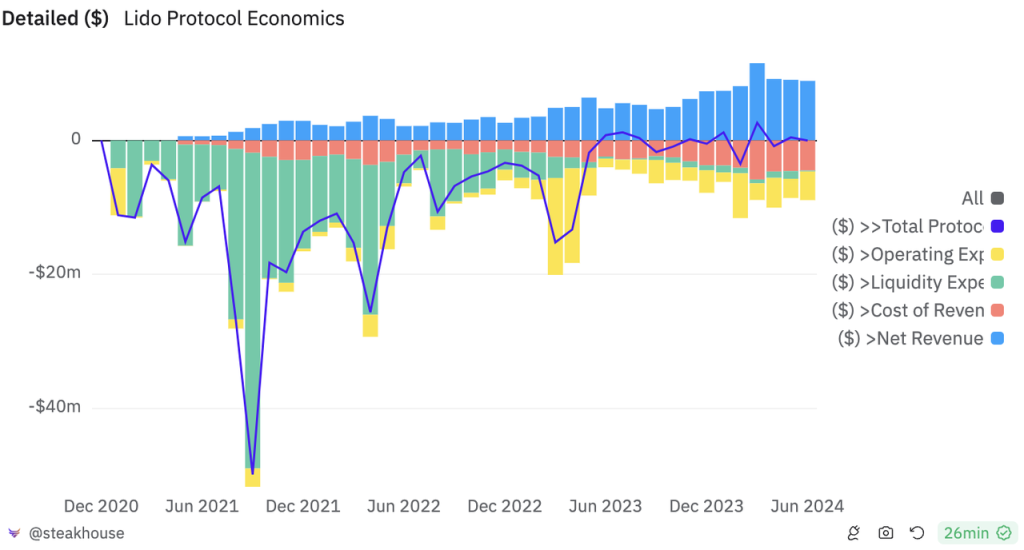
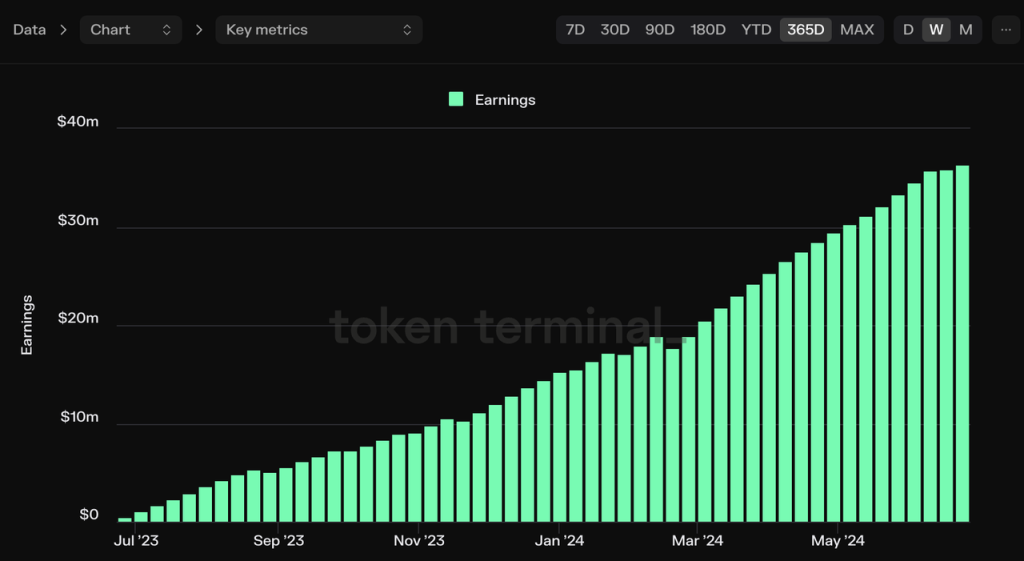
With the successful rollout of the Shapella upgrade, Lido has cemented its position in the market. The profitability indicators, reflecting the “revenue/token incentive” metrics, have shown impressive results, with Lido generating $36.35 million in profits over the last year.
This situation has led to anticipation within the community for potential adjustments to the $LDO tokenomics. However, Lido’s de facto leader, Hasu, has repeatedly expressed that the current revenue from the community treasury does not suffice to cover all of Lido DAO’s ongoing expenses over the long haul. He emphasizes that discussions on revenue distribution are premature given the financial landscape.
Risks and Challenges
Lido faces the following risks and challenges:
- Competition from newcomers. Lido’s market share has been on the decline since the release of Eigenlayer. New projects equipped with significant token marketing budgets pose a threat to established leaders like Lido, particularly as Lido’s tokens are almost fully circulated.
- Members of the Ethereum community, including several from the Ethereum Foundation, have long harbored reservations about Lido’s dominant market share in staking. Vitalik Buterin has addressed these concerns directly, publishing an article that explored potential solutions, yet he refrained from endorsing any particular option. For those interested in a deeper dive, you can read our previous analysis: Evaluating Vitalik’s Proposals on Ethereum Staking.
- On June 28, 2024, the SEC’s allegations against Consensys explicitly classified LST as a security. The act of minting and buying stETH by a user was characterized by the SEC as “Lido’s issuance and sale of unregistered securities.” Furthermore, Consensys faced accusations for issuance and sale of unregistered securities by providing users with the ETH staking service.
Perpetual Exchange: GMX
GMX is a decentralized perpetual exchange, first going live on Arbitrum in September 2021 and subsequently launching on Avalanche in January 2022. The platform functions as a two-sided market: on one side are traders, who can open positions with leverage up to 100x; on the other side are liquidity providers, who supply the liquidity of their assets for trading purposes and serve as counterparties to the traders.
In terms of business model, GMX’s revenue streams primarily come from trading fees, which vary between 0.05% and 0.1%, in addition to funding and lending fees charged to traders. GMX distributes 70% of all its revenue to liquidity providers, while the remaining 30% is allocated among $GMX token stakers.
Business Overview
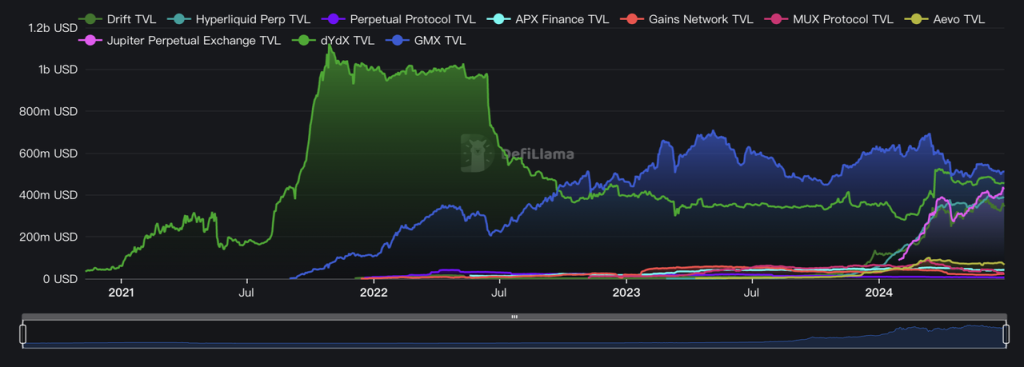
The field of perpetual trading platforms is characterized by frequent new entrants like Aevo, Hyperliquid, Synfutures, and Drift, which often offer traceable airdrops, and established platforms that provide trade-mining incentives, such as dYdX, Vertex, and RabbitX. Given these factors, trading volume data may not fully reflect the true competitive landscape. Therefore, we will utilize metrics such as Total Value Locked (TVL), Price to Sales (PS), and profits to provide a comparative analysis of GMX alongside its competitors.
GMX currently holds a leading position in terms of TVL. Nonetheless, other significant players in the space, such as the established derivatives protocol dYdX, Jupiter Perp with its substantial traffic gateway on Solana, and the forthcoming Hyperliquid, are also showcasing TVL figures that are comparable to GMX’s.
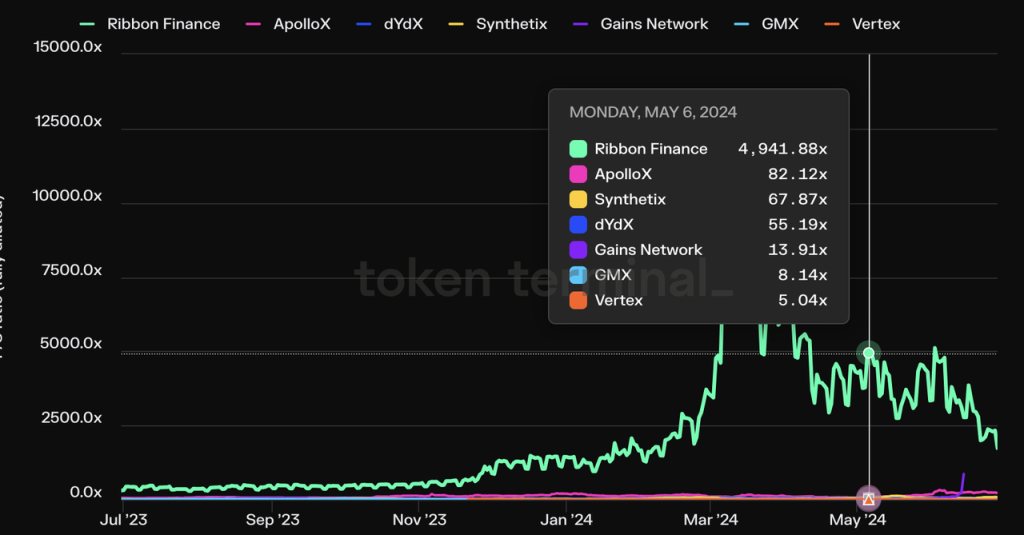
When considering the PS ratio, GMX stands out for its relatively low valuation in the segment of projects that have issued their tokens, focus on perpetual trading and have an average daily trading volume of over $30 million. The only competitor with a lower PS ratio is Vertex, which continues to engage heavily in trade mining incentives.
Looking at profit metrics, GMX recorded profits of $6.5 million in the past year, which are less than those of competitors such as dYdX, GNS, and SNX. However, it is critical to understand that this figure was significantly impacted by GMX’s decision to release all 12 million $ARB tokens rewards during the Arbitrum STIP event from November 2023 to March 2024. These tokens had an estimated value of $18 million, based on ARB’s average price at the time, which notably diminished the reported profits. Despite this, the trend in profit accumulation proves GMX’s robust ability to generate profits.
Competitive Advantages
Relative to the other DeFi projects mentioned, GMX has a comparatively weaker competitive edge. the frequent emergence of new programs on derivatives exchanges in recent years has largely impacted GMX’s trading volume and the marketplace remains congested. Despite these challenges, GMX maintains several key strengths:
- Robust Support from Arbitrum: GMX, as a native project within the Arbitrum ecosystem, was responsible for nearly half of Arbitrum’s TVL during its peak periods. At that time, virtually every new DeFi project on Arbitrum was tailored to “cater to GLP,” which not only provided significant exposure from the Arbitrum official channels but also resulted in GMX receiving a substantial amount of ARB tokens through various incentive events—including an initial airdrop of 8 million and an additional 12 million from STIP activities. This substantial token accumulation greatly enriched GMX’s treasury and provided crucial marketing resources for GMX, whose tokens are already fully circulated.
- Established Leadership and Strong Reputation: GMX significantly shaped the “Real DeFi Yield” narrative from late 2022 through early 2023, a rare bright spot in the DeFi space during that bearish market period, and GMX took the opportunity to build a strong brand reputation and attract a dedicated and loyal user base.
- Economies of Scale Advantage: GMX, as the leading perputual trading platform, is a beneficiary of this scale effect. When liquidity providers (LPs) are large enough, they can accommodate larger trading orders and higher open positions, which in turn generate higher returns for LPs. For example, Andrew Kang, a renowned trader, frequently opened long and short positions worth tens of millions of dollars on GMX. At that time, GMX was almost the only option for placing such large orders on-chain.
Valuation Insights
GMX has reached full circulation. As highlighted in our earlier cross-industry comparison, GMX presently has the lowest valuation among leading perpetual exchanges.
In a longitudinal comparison with its historical data, GMX’s revenue has demonstrated consistent stability and its PS ratio has tended to fall within a moderately low range
Risks and Challenges
- Intense Competitive Landscape: GMX faces formidable competition not only from well-established DeFi protocols like Synthetix and dYdX, which continue to innovate and drive activity, but also from rising newcomers, such as AEVO, specializing in token swaps, and Hyperliquid, which has not yet issued its tokens, have both gained significant attention and trading volume over the past year. Jupiter Perp, leveraging its substantial access to Solana’s traffic, has managed to match GMX’s TVL and even surpass its trading volumes using a nearly identical mechanism to GMX. GMX is currently gearing up to roll out their V2 version on Solana, yet the overall competitive environment remains highly intense, lacking a defined pattern like the other DeFi tracks. Additionally, the prevalent trade mining incentives lower barriers to user migration, generally leading to lower user loyalty.
- GMX relies on oracle prices as the price basis for trading and liquidation, which introduces a vulnerability to oracle attacks. In September 2022, GMX suffered a loss of $560,000 due to an oracle attack on AVAX. Despite this, the costs associated with executing such attacks (i.e., manipulating the CEX prices of the tokens involved) are typically prohibitive relative to the gains. To further protect against these risks, the GMX V2 update has introduced measures like segregated pools and adjustments for trading slippage.
Other Noteworthy DeFi Projects
Beyond the DeFi projects previously discussed, our research has identified other compelling projects within the space, including the well-established stablecoin MakerDAO, the rising star Ethena, and the foremost oracle solution Chainlink. Unfortunately, space constraints prevent a comprehensive presentation of these projects in this document. Moreover, each of these projects encounters its own set of challenges, including:
While MakerDAO continues to lead in the decentralized stablecoin sector and boasts a significant base of natural holders—who treat DAI similarly to how they would USDC or USDT—the size of its stablecoin has not advanced, remaining at roughly half of its previous peak in terms of market cap. Furthermore, its reliance on off-chain dollar assets for collateral is progressively eroding the decentralized trust associated with its token.
Ethena’s stablecoin, $USDe, sharply contrasts with MakerDAO’s DAI, having surged from zero to $3.6 billion within approximately six months. Despite this impressive growth, Ethena’s business model, which centers on a public fund dedicated to perpetual arbitrage, inherently faces limitations. The substantial scale-up of its stablecoin hinges on secondary market participants’ willingness to purchase its $ENA token at elevated prices, a strategy that underpins the high-yield subsidies necessary to sustain USDe expansion. This slightly Ponzi-like design becomes highly vulnerable during times of poor market sentiment, potentially leading to a downward spiral in both business and token prices. A pivotal moment for Ethena could arise if USDe can genuinely establish itself as a decentralized stablecoin embraced by a substantial base of ‘natural holders,’ thereby shifting from being a public arbitrage fund to a stablecoin operator. However, given that the underlying assets of USDe are largely tied to arbitrage positions on centralized exchanges, it faces significant hurdles related to both ‘decentralized censorship resistance’ and ‘robust institutional endorsement.’ This makes it extremely challenging for USDe to replace DAI and USDT.
After making its mark in the DeFi sector, Chainlink is gearing up for an under-the-radar yet potentially massive shift in narrative, driven by financial behemoths like BlackRock that have progressively embraced Web3 technologies. This shift focuses on the integration of Real World Assets (RWA). Apart from advocating for BTC ETF and ETH ETF, one of BlackRock’s standout initiatives this year was the tokenization of a U.S. Treasury bond fund, named ‘Build,’ on Ethereum, which amassed over $380 million in just six weeks. The experimentation with financial products on blockchain by traditional financial giants will continue, inevitably grappling with issues like the tokenization of off-chain assets and enhancing both on-chain and off-chain communications and interoperability.
Chainlink’s explorations in blockchain interoperability are quite advanced. For instance, in May of this year, Chainlink completed a “Smart Asset Net Worth” project with the Depository Trust and Clearing Corporation (DTCC) and several major U.S. financial institutions. This pilot project aims to establish a standardized process for aggregating and disseminating fund net asset value (NAV) data on private or public blockchains using Chainlink’s interoperability protocol, CCIP. Additionally, in February, asset managers Ark Invest and 21Shares announced the validation of position data by integrating with Chainlink’s Proof of Reserve platform. However, Chainlink still faces challenges with its business value being detached from its tokens. The lack of value capture and rigid application scenarios for $LINK tokens raises concerns that holders will find it difficult to benefit from the growth of Chainlink’s business.
Conclusion
As with many transformative products, DeFi has traced a distinctive trajectory since its inception. It started with the narrative building of its ‘Genesis Year’ in 2020, followed by a rapid bubble in 2021, and then moved into a phase of disillusionment following the bubble’s burst in the 2022 bear market. Now, with its Product-Market Fit (PMF) robustly established, DeFi is climbing out of the trough of narrative disillusionment, and building its intrinsic value with a solid business.
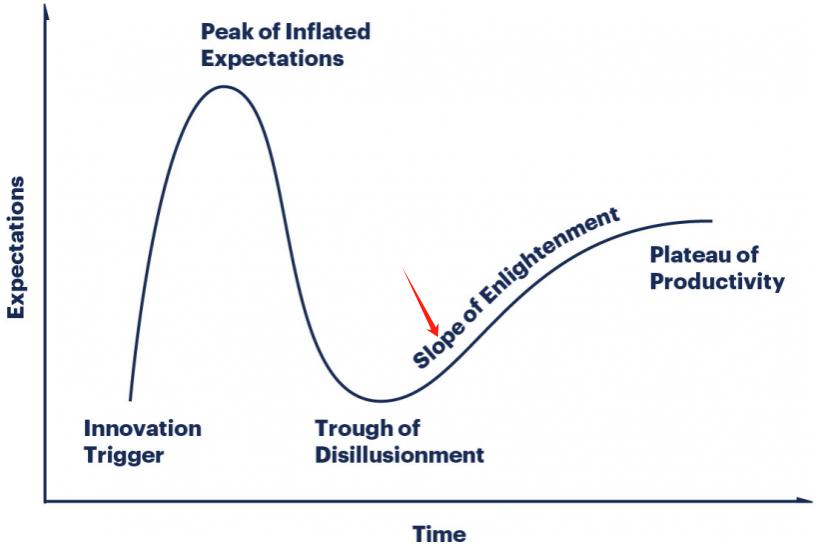
I am convinced that DeFi, characterized by its mature business models and expanding market potential, is worthy of sustained focus and investment.
