


In our previously published “Sifting for Gold: Identifying Long-Term Investment Targets Through Market Cycles (2025 Edition – Part I)“, we analyzed lending sector projects, including Aave, Morpho, Kamino, and MakerDAO, as well as staking sector projects Lido and Jito. Part II will continue exploring fundamentally strong projects with long-term potential.
PS: This article reflects the authors’ perspectives as of publication date, which may evolve over time. The views expressed are highly subjective and may contain factual, data, or logical errors. None of the content constitutes investment advice. We welcome critiques and further discussions from industry peers and readers.
Contents
3. Trading Sector:Cow Protocol、Uniswap、Jupiter
3.1 Cow Protocol
Current Business Status
Product and Mechanism
Cow Protocol is a decentralized trading aggregation protocol. Its core product is the decentralized trading aggregator, CoW Swap. The “CoW” in the name stands for Coincidence of Wants, referring to the matching mechanism that directly aligns the needs of buyers and sellers. CoW Swap uses batch auctions as a price discovery mechanism, consolidating users’ trading intentions (order demands) and settling them collectively in each block.
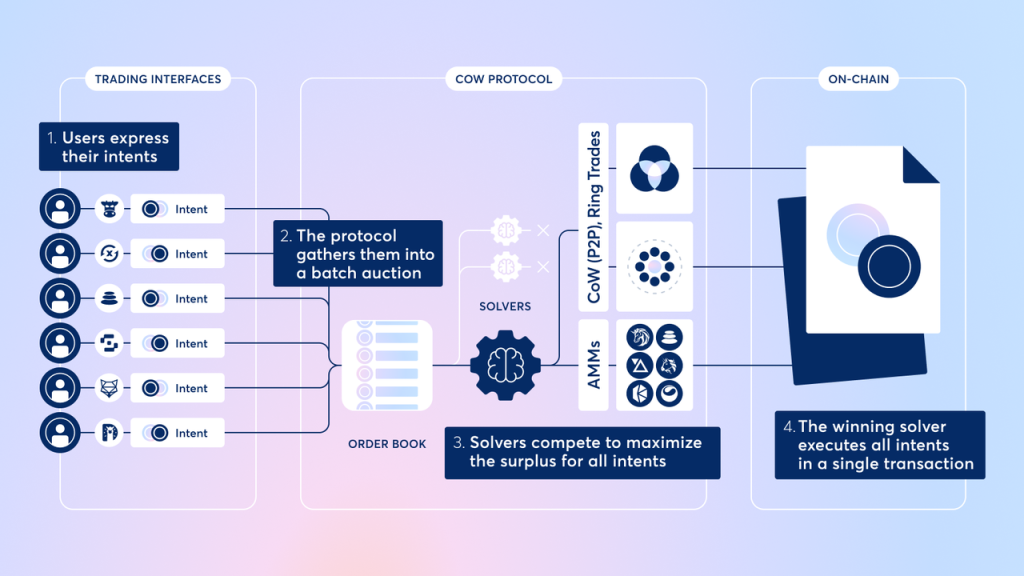
This mechanism allows users’ orders to be directly matched without needing traditional market makers or liquidity pools. When two parties want to exchange assets that meet each other’s needs, the transaction can be completed directly, avoiding intermediate fees. For orders that cannot be directly matched, CoW Swap routes the remaining orders to decentralized exchanges (DEXs) or other aggregators to obtain liquidity. This design minimizes slippage and fees, while batch matching ensures that all transactions executed in the same batch share the same settlement price, eliminating price unfairness due to transaction order.
Additionally, CoW Swap introduces a Solver bidding mechanism: multiple third-party solvers compete to provide users with the best execution strategy, where the winner gains the right to execute the batch and also covers the on-chain gas fees. Users only need to sign their order intentions offline, without having to pay on-chain fees themselves, and incur no transaction costs if unfilled. This “intention matching + solver bidding” model enhances user experience (no need to worry about gas losses from failed transactions) and provides a degree of MEV (Maximal Extractable Value) protection—since order matching occurs off-chain, solvers must bid to return MEV to the user, making front-running and other MEV attacks less effective.
CoW Swap currently operates on Ethereum, Arbitrum, Gnosis, and Base.
Beyond Cow Swap, another product of Cow Protocol is MEV Blocker, developed in collaboration with CoW DAO, Beaver Build, and Agnostic Relay. By switching the wallet’s RPC to MEV Blocker, users’ transactions are routed through a private searcher network (instead of entering Ethereum’s public mempool visible to all searchers, which leads to MEV attacks), preventing sandwich and front-running attacks from the start.
*The process of regular transactions on the Ethereum network being packaged into blocks: Users initiate transactions, which first enter the public mempool; searchers monitor the mempool for MEV opportunities and package transactions into bundles; builders receive bundles from searchers and construct blocks; validators receive blocks from builders, verify them, and add them to the blockchain.
Revenue Model
Cow Protocol’s revenue sources are broadly divided into two categories:
- Surplus from CoW Swap Transactions: This refers to the extra savings CoW Swap provides to users through its bidding network, compared to the initial quote. CoW Swap currently charges a fee of 50% on surpluses across most networks, but this fee does not exceed 1% of the transaction volume. Additionally, for external protocols (partners) integrated with Cow Protocol, Cow Protocol takes 15% of the transaction fees generated by these partners as a service fee, with the percentage defined by the partner but not exceeding 1% of the transaction volume. Lastly, Cow Protocol charges a fee on the total network transaction volume for certain networks like Gnosis and Arbitrum, currently set at 0.1% of the transaction volume (excluding special trades like stablecoins).
- Revenue from MEV Blocker: A rate of about 10% is deducted from the revenue validators earn through MEV Blocker.
In the income structure of the protocol, the majority of revenue is contributed by the surplus from CoW Swap transactions, so our focus will primarily be on CoW Swap’s business data.
Business Data
We will focus on two key business metrics: the transaction volume of Cow Protocol and its protocol revenue.
Transaction Volume
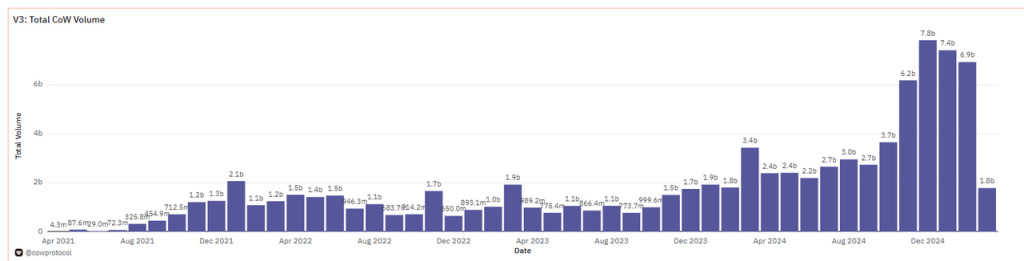
As an emerging intent matching protocol, CoW Swap has experienced rapid development over the past three years. In 2021, the protocol was still in its early stages, with small transaction volumes. Entering 2022-2023, the CoW Protocol saw its business data improve as demand for MEV protection and efficient aggregated trading grew in the DeFi space. By 2024, transaction volume increased significantly: monthly volumes hit a record high at the end of 2024, with nearly 7.8 billion in December alone and around 6.9 billion in February 2025, far exceeding previous years.
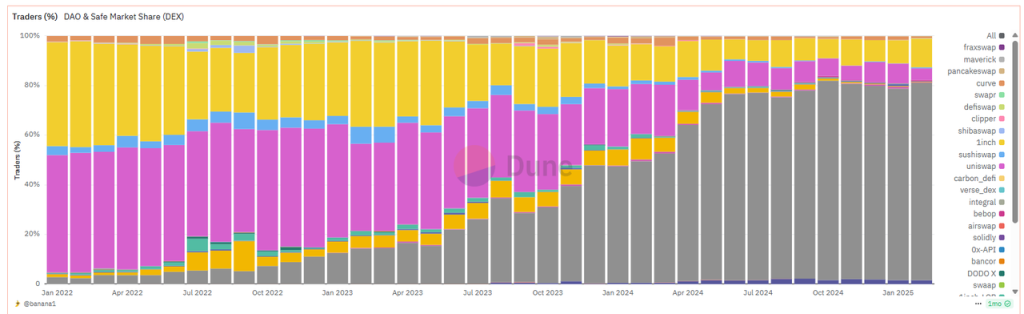
Notably, CoW Swap is increasingly favored by DAOs and professional institutions for providing large, low-slippage trading solutions. In 2023, about one-third of the DAO on-chain transaction volume was completed through CoW Swap, and by February this year, this proportion had risen to 79.5%.
Protocol Revenue
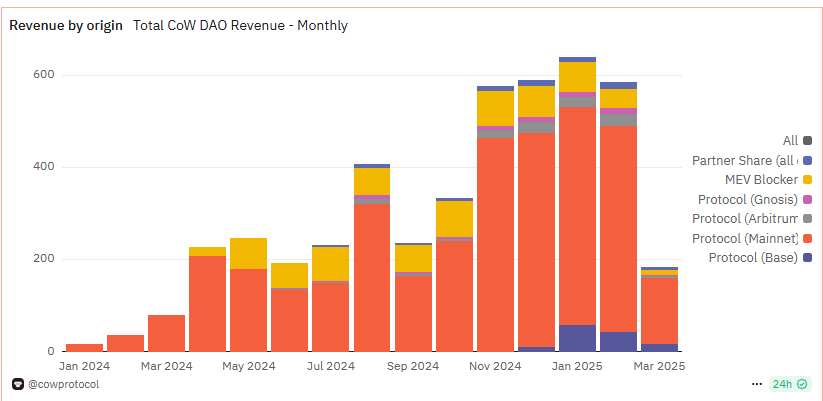
After entering 2024, the Cow Protocol began actively exploring revenue generation, conducting multiple rounds of revenue testing. This resulted in a steady month-by-month increase in income. January 2025 marked the highest revenue month, with 641 ETH earned. Calculated at an average ETH price of 3,328 per month, this amounts to approximately 2.13 million. In February, revenue was 586 ETH, with an average ETH price of 2,668, bringing in 1.56 million.
Protocol Incentives
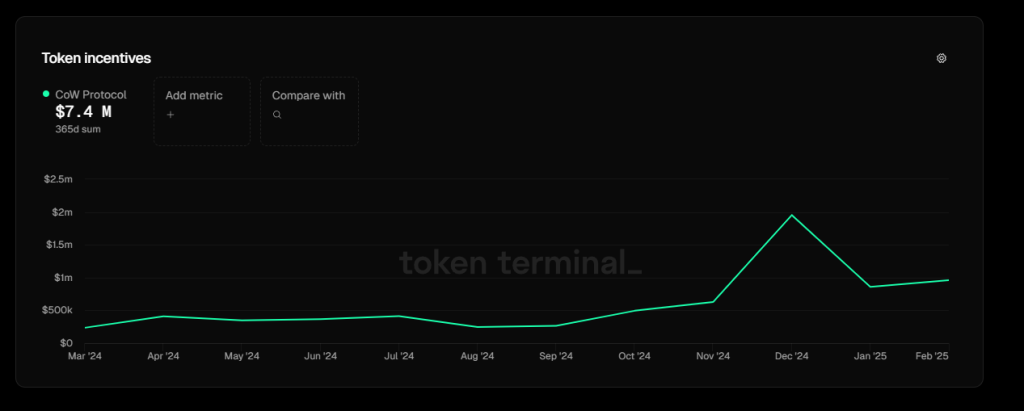
Currently, Cow Protocol’s main expenses are token incentives given to network solvers. These solvers receive COW tokens as rewards based on the quality of the trading solutions they provide, specifically the surplus they generate for traders. According to Token Terminal statistics, over the past year, spending on COW token rewards was approximately 7.4 million. In January and February 2025, protocol token incentives were 858,000 and 961,000, respectively, both below the protocol′s revenues of 2.13 million and $1.56 million for the corresponding months.
According to Cow Protocol’s official disclosure of the 2024 project budget in January, excluding development costs, the token rewards given to solvers amounted to about 5.2 million, while the annual protocol revenue was approximately 6 million, meaning revenue has already surpassed the token incentive expenditure.
Competitive Landscape
The main battlefield for Cow Protocol is the decentralized exchange aggregator sector. Initially dominated by 1inch, the landscape has diversified over the past two years. According to The Block’s latest data from March 2025 (excluding UniswapX), 1inch has lost its leading position (following a March 5th attack on its Fusion function, resulting in losses of over $5 million and increasing user concerns about its security), now ranking second with a 22.8% market share. Meanwhile, CoW Swap has taken the lead with 33.85%, marking its first time at the top in monthly data.
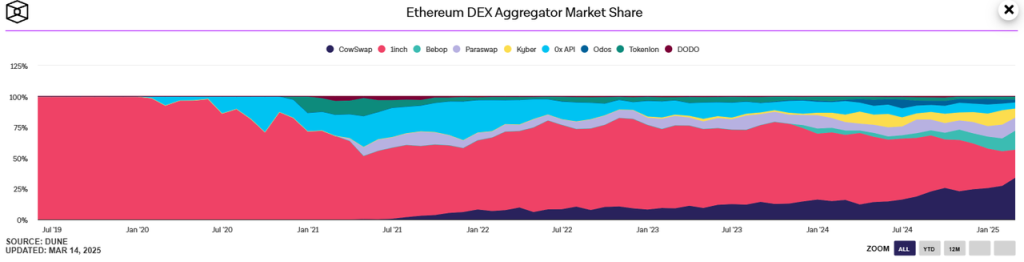
In addition to 1inch and CoW, the other top five aggregators include ParaSwap, 0xAPI/Matcha (an aggregation interface provided by the 0x protocol), KyberSwap, and Bebop. These competitors each hold a market share of around 10% or less. ParaSwap and 0x have a longer history and stable user base, while KyberSwap (transitioning from Kyber Network to aggregation) and Wintermute’s Bebop have recently gained incremental users. Overall, competition in the DEX aggregator space remains fierce, with new players continually emerging. Although CoW Protocol has become the new leader, its position is not yet secure.
Beyond traditional aggregation products, two other noteworthy competitors are Uniswap’s UniswapX and Particle Network’s cross-chain trading platform, UniversalX.
Uniswap
UniswapX is a cross-platform aggregation trading feature launched by the Uniswap team in the second half of 2023. Essentially, UniswapX provides users with a similar mechanism of intent orders and fillers. Users submit offline signed orders on the Uniswap front end, and third-party “fillers” in the network can fill these orders and trade on-chain for the users. The process involves fillers providing a quote and enjoying exclusive matching rights for a short period. If the transaction isn’t completed within this time, it enters a Dutch auction phase, allowing more fillers to bid. This model is quite similar to CoW Swap’s solver bidding, both being off-chain matching and on-chain settlement solutions. Leveraging Uniswap’s brand and extensive user base, UniswapX quickly integrated into its front-end interface and went live on the Ethereum network. It’s noteworthy that there were industry accusations of UniswapX “copying” CoW Swap’s intent matching model. Critics, including Curve’s official channels, pointed out that CoW Swap had already pioneered the solver model, suggesting UniswapX was not an original innovation. Despite the controversy, UniswapX swiftly captured substantial trading volume within the Uniswap ecosystem. In early 2024, its share in the EVM aggregation trading market briefly exceeded 10% (compared to CoW Swap’s 14% at that time). However, its market share gradually declined, and according to data disclosed by Cow Protocol in March, UniswapX’s market share in aggregated trading is now around 5.5%.
UniversalX
UniversalX is another highly anticipated new project focusing on cross-chain aggregated trading. Launched by Particle Network, it went live on the mainnet at the end of 2024. The aim is to enable trading of assets across any chain without the need for cross-chain bridges. Its core concept is “chain abstraction,” allowing users to deposit assets from multiple chains into a unified on-chain account. Through the UniversalX platform, users can trade tokens from any chain using a unified balance, with the platform automatically handling cross-chain exchanges and settlements in the background. As a new entrant in the aggregator space, UniversalX targets the cross-chain trading niche, setting itself apart from projects like CoW Protocol, which primarily focus on single-chain aggregation. However, as the multi-chain ecosystem evolves, UniversalX could potentially become a competitor to CoW Protocol. If CoW Protocol expands to more chains or offers cross-chain capabilities, it would enter the competitive domain of UniversalX.
Cow Protocol’s Competitive Advantages
In the face of intense competition, Cow Protocol has been able to rise and grow steadily, and its competitive advantages can be analyzed from two aspects: product and brand.
- Product:
- Technical and Mechanism Advantages of Trading Products: Cow Swap is the first protocol to apply batch auction matching and solver competition to DEX aggregation, giving it a first-mover advantage. Its unique Coincidence of Wants matching mechanism allows direct trades without relying on traditional liquidity pools, reducing slippage and fees. The unified clearing price mechanism prevents price manipulation due to trade order, enabling heavy traders, particularly institutions, to execute at fair prices. In comparison, later approaches like UniswapX and 1inch Fusion have similar ideas but differ in implementation. For instance, CoW Swap uses sealed bidding every block, where all solutions are submitted simultaneously and executed optimally, minimizing MEV opportunities. This is considered more effective at preventing unfair practices like front-running than UniswapX’s time-limited exclusive fills and Dutch auctions.
- MEV Protection and Security: The combination of Cow Protocol’s trading services and MEV Blocker further enhances protection against MEV, removing user trades from Ethereum’s public mempool and allowing trusted solvers to batch them before publishing on Ethereum. This effectively reduces the risk of MEV attacks such as front-running and sandwich attacks. The protocol also imposes strict limits on the slippage and execution results of solver quotes, compressing the space for miners and searchers to extract MEV. These measures make Cow Swap one of the most user-protective trading platforms currently available, especially appealing for large trades and DAO treasury managers due to its strong MEV protection.
- Brand
- Cow Protocol, as the first to introduce batch auction matching and solver competition mechanisms, combined with its MEV-resistant features, has established a strong value proposition of safety and cost savings for traders. It has become the top choice in the minds of large traders, a preference that is unlikely to change easily. This user habit stems from the brand and reputation built on the product’s strengths, which is also the source of the protocol’s eventual profitability.
Main challenges and risks
Intense Competitive Environment
In the fiercely competitive landscape of aggregated trading platforms, established projects like 1inch, Kyber, and DoDo are leading the charge, while new players such as Bebop, backed by Wintermute, join the fray. Additionally, products like CEX and wallets that have closer user proximity, and possess strong entry points and frontend advantages, along with chain-abstract concepts like UniversalX, are continuously exploring trading product innovations and striving for greater user penetration. Over the long term, their relationship with Cow Protocol is more competitive than collaborative. Therefore, even though Cow Protocol has currently surpassed 1inch to become the leader in market share, maintaining this position in such a high-pressure environment is challenging. It directly affects the protocol’s bargaining power with users and suppliers (solvers), creating a clear conflict between the goals of “market share” and “protocol profit.”
Market Cycles
A downturn in the overall market cycle will lead to a contraction in total trading volume, impacting CoW Swap’s transaction volumes significantly, which is self-explanatory. Other trading products are similarly affected, so this point will not be elaborated further.
Ties to the EVMEcosystem
Currently, Cow Protocol only operates within the Ethereum ecosystem. If the Ethereum ecosystem underperforms compared to other blockchains, it will naturally limit Cow Protocol’s potential for development. Uniswap, discussed later, faces a similar risk, so I won’t repeat this point.
Valuation benchmark
COW Token
Cow has a total supply of 1 billion tokens. According to Coingecko, the current circulation rate is about 41.5%, with a projected token inflation rate of 19.61% over the next year.
Currently, the primary use case for Cow tokens is governance. As protocol revenue increases, there may be token buybacks. Previously, there were attempts to reduce fees through Cow staking.
Valuation
Looking at Cow’s valuation over time, its FDV hit a new high in this cycle as business metrics continue to rise. Excluding the initial month’s anomalies due to extremely low token circulation, the peak market cap reached 990 million at the end of December last year but then experienced a sharp decline, now standing at approximately 280 million.
We compare Cow’s Price-to-Sales (PS) ratio by analyzing the FDV in relation to protocol revenue.
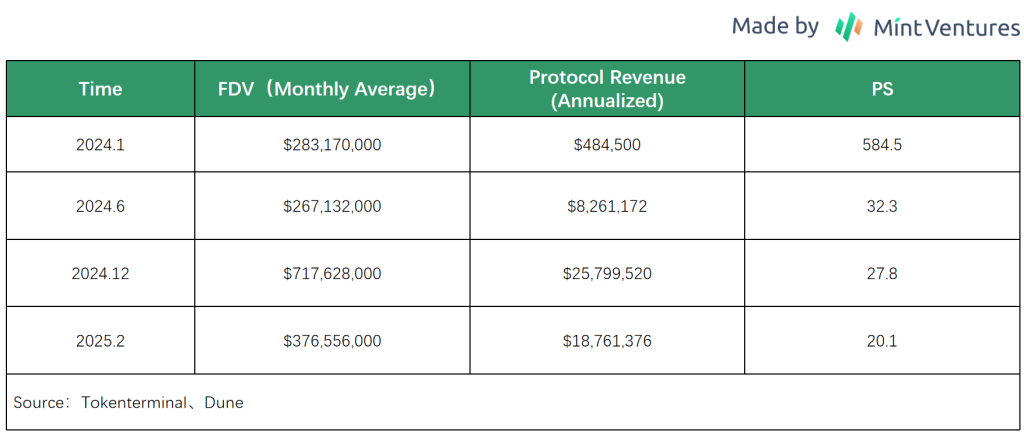
The chart shows that despite Cow’s FDV maintaining an upward trajectory over the past year or so, its PS ratio has exhibited a notable decline alongside rising business revenue, making it more valuation-attractive compared to previous levels.
From a horizontal comparison perspective among competitors, within comparable projects in the aggregation protocol sector, 1inch serves as the most direct counterpart. Given that 1INCH currently lacks a direct token value capture mechanism and the protocol does not generate stable, publicly disclosed protocol revenue, we primarily conduct the comparative analysis through the FDV-to-trading volume ratio between the two protocols.
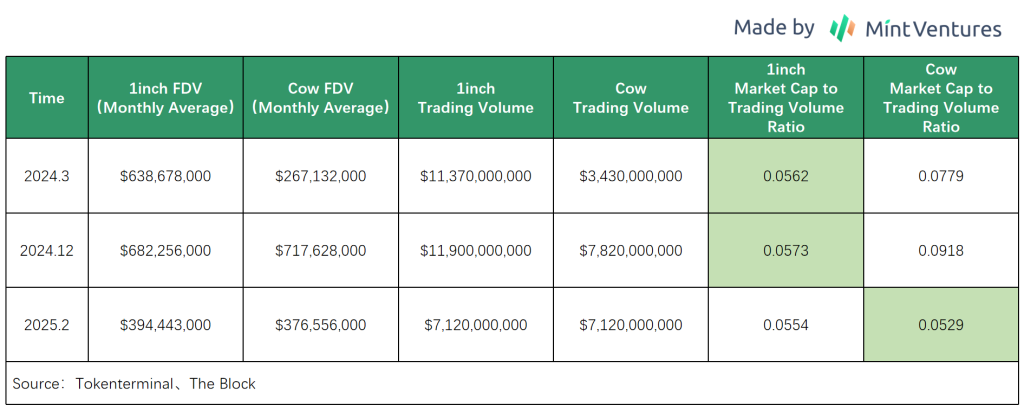
From the chart, we can see that as Cow’s price decreased and business data improved, its market cap to trading volume ratio fell below that of 1inch for the first time since February 2025, offering better relative value.
3.2 Uniswap
Current Business Status
Core Products
Uniswap is the largest decentralized exchange (DEX) on Ethereum. Its main products currently include the DEX protocol (now deployed on the Ethereum mainnet and several scaling chains) and the newly launched Unichain, a dedicated Layer 2 network.
The fee switch for the Uniswap protocol hasn’t been activated yet, so the protocol itself hasn’t generated direct revenue in the past. However, Uniswap Labs does charge a 0.15% interface fee on token trades via its official front end.
With the launch of Unichain in November 2024, there will be a new way to distribute value directly to UNI holders by staking UNI to share in transaction sequencer fees without needing to activate the fee switch.
Business Data
For Uniswap, the key business metrics are trading volume and fees. As for Unichain, we focus on the number of active addresses on the chain, the main ecosystem, and the amount of capital on the chain.
DEX Trading Volume and Fees
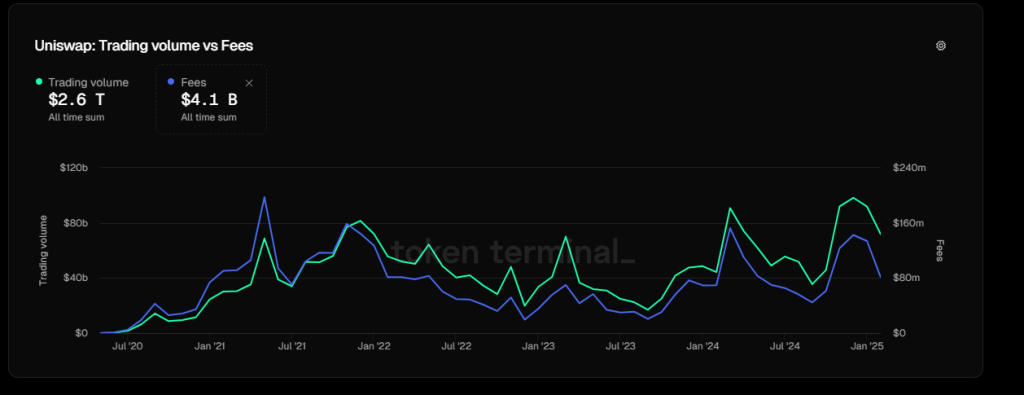
Uniswap’s trading volume has generally continued to grow with the market, hitting all-time monthly highs in March and December of the past year. However, with the market cooling recently, trading volume has noticeably declined.
It’s worth noting that in this cycle, Uniswap’s fee metrics have not surpassed the peak and secondary peak of the previous cycle, indicating that the fee rates are decreasing over time, leading to more intense competition among liquidity providers (LPs).
Multi-Chain Data
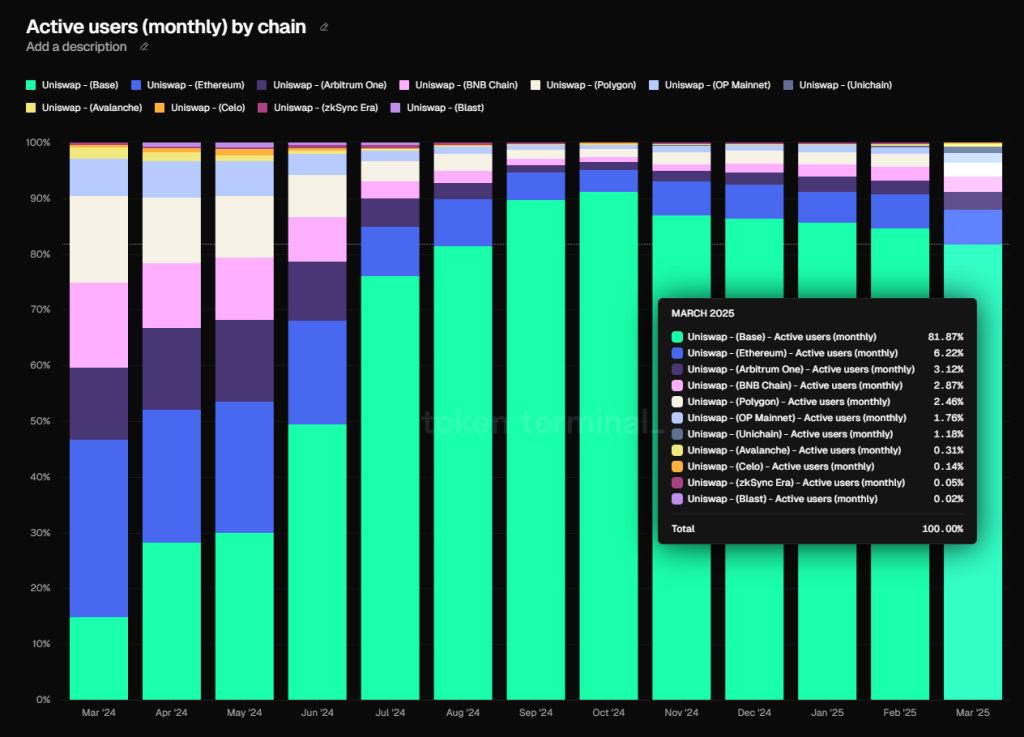
Thanks to multi-chain deployment (currently covering 11 EVM chains), especially with Coinbase’s launch of Base, Uniswap’s active users reached a record high of 19 million last October. This growth rate in active users far outpaces the growth in trading volume, highlighting Layer 2’s ability to attract new users.
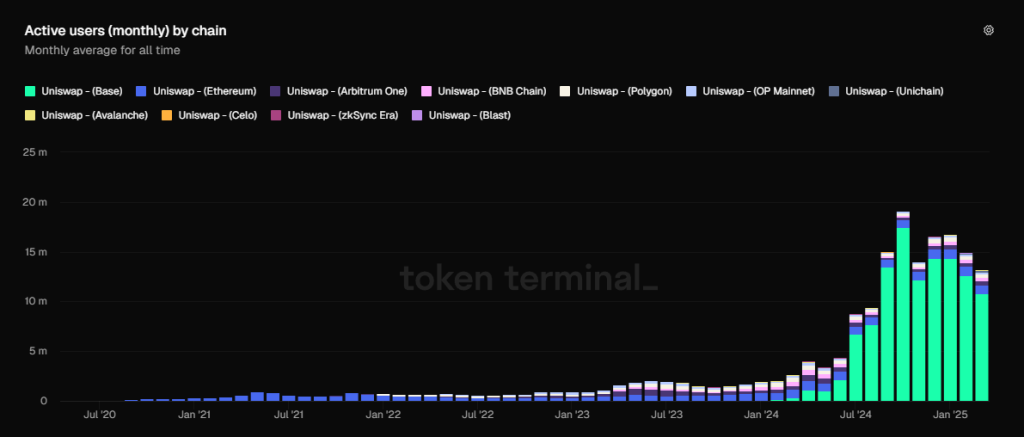
Among them, Base is the main contributor to active users, accounting for 82% of Uniswap’s active users across all chains.
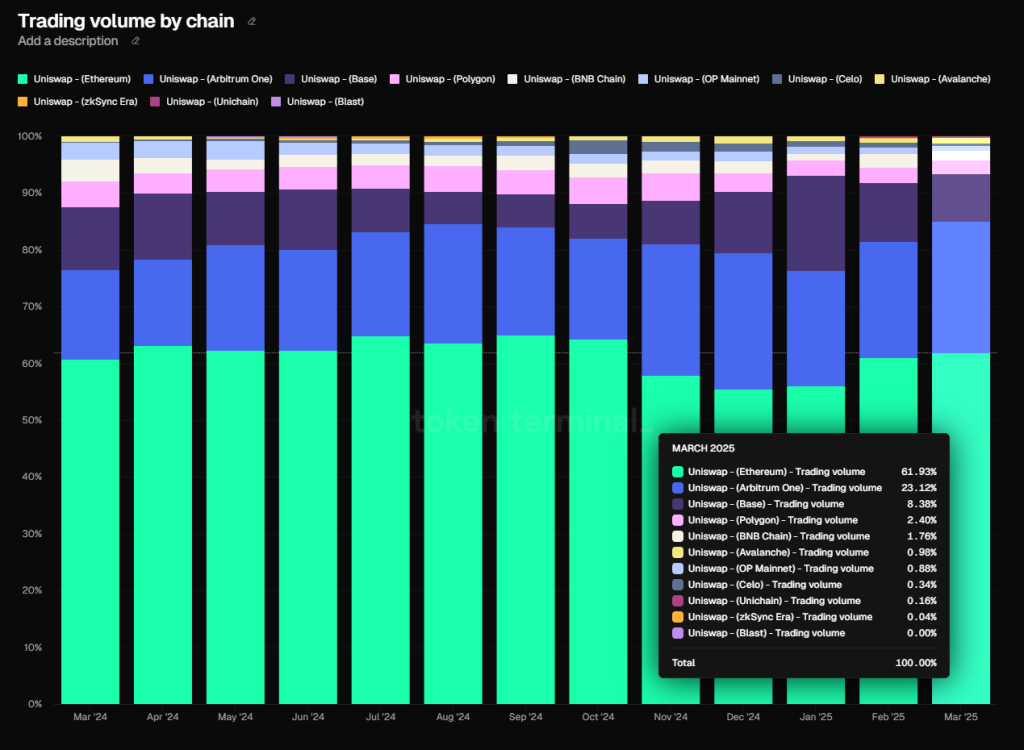
However, in terms of trading volume, Ethereum remains Uniswap’s main battleground, accounting for about 62% of the volume, followed by Arbitrum with 23%, and then Base with 8.4%.
Unichain’s Business Data
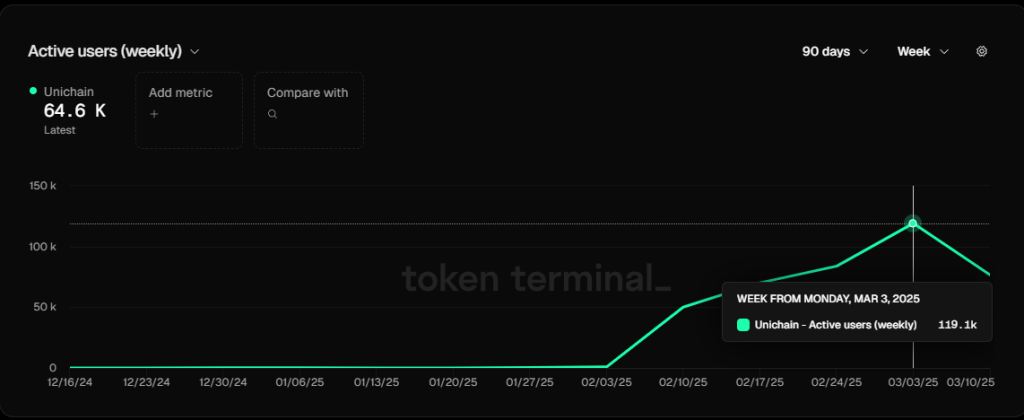
Since its official launch in early February this year, Unichain has grown rapidly. By early March, the number of weekly active addresses reached nearly 120,000, ranking 7th among all L2 projects, ahead of well-known L2s like zkSync, Manta, and Scroll.
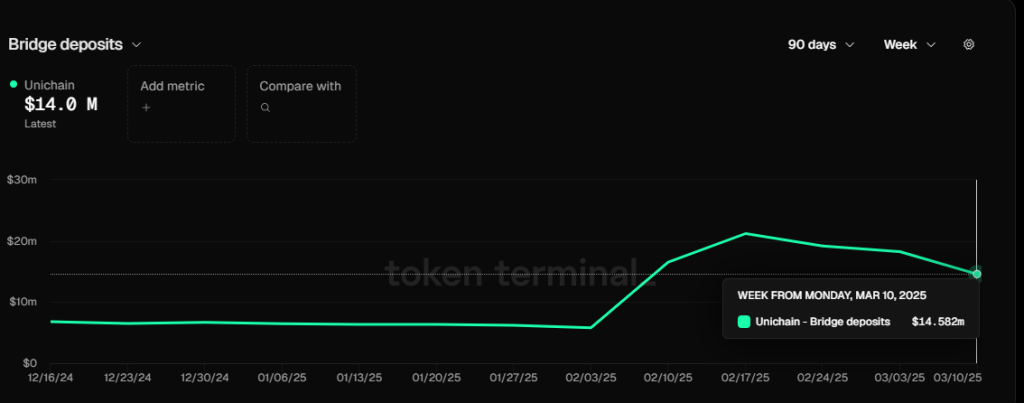
However, the value of assets bridged on Unichain remains low, currently only around $14 million.
In terms of the ecosystem, Unichain’s official list includes over 80 projects, but most have not yet launched. For example, in DeFi, aside from Uniswap itself, the only notable app currently live is Venus, with total deposits of $5.67 million.
Competitive Landscape
Over the past year, Uniswap has remained a leader in the DEX market within the EVM ecosystem, holding the top market share. However, its overall market share has been declining. The chart below shows the market share trends of all DEXs in the EVM ecosystem (including all EVM L1 and L2).
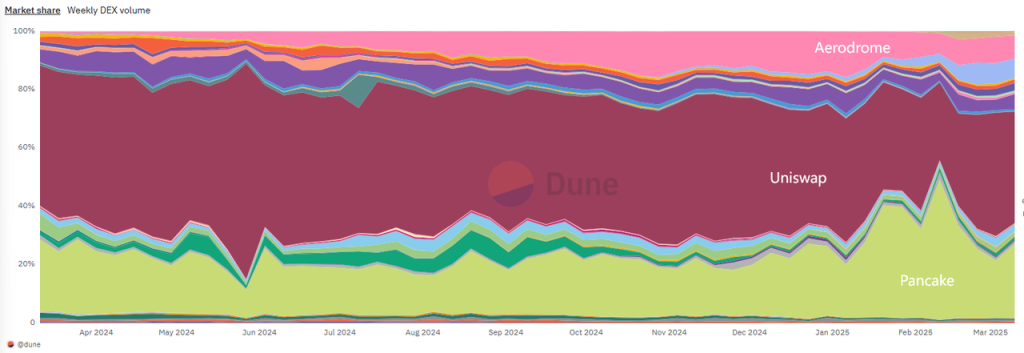
The second place is Pancakeswap, and the third is Aerodrome, which are the leading DEXs on Bnbchain and Base, respectively (even though Uniswap has also been deployed on these two chains).
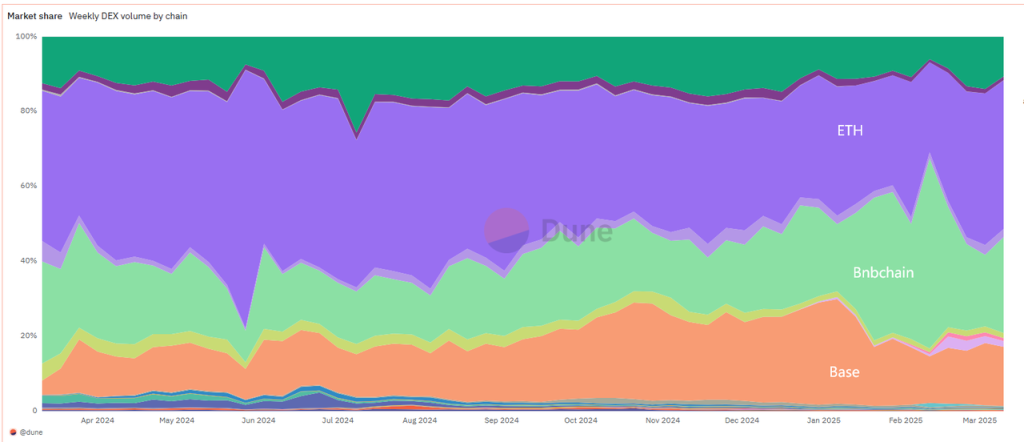
ETH, Bnbchain, and Base are the three largest chains by transaction volume in the EVM ecosystem, which aligns with the market share rankings of Uniswap, Pancakeswap, and Aerodrome.
As for Unichain, since it’s relatively new, its ecosystem is still quite underdeveloped and is in the early stages of application and funding. Apart from a good growth in active users, its other metrics lag significantly behind mainstream L2s.
Uniswap’s Competitive Advantages
Uniswap’s competitive advantages can be summarized as follows:
- Network Effects and Liquidity Depth The largest liquidity pools attract the most traders and vice versa. More traders and transaction volume draw more tokens to deploy liquidity here, creating a self-reinforcing cycle.
- Brand and User Habit Stickiness As the first project to popularize the AMM model in the DeFi space, Uniswap has unparalleled brand recognition and credibility. It holds a strong position in the minds of traders and liquidity providers. Even with a plethora of DEXs and aggregators available, many users habitually conduct transactions on Uniswap’s front-end, despite it charging an additional transaction fee. Uniswap’s brand has been instrumental in building its L2 platform, attracting many quality projects for testing and joining right from the start, with rapid user growth.
- Ecosystem Positioning Through Multi-Chain Deployment Uniswap has deployed its products on most major EVM chains, consistently ranking in the top three by transaction volume. This strategy has helped Uniswap maintain its foundational ground in the multi-chain era and laid the groundwork for subsequent multi-chain aggregation features, facilitating easier liquidity interchange across chains.
Main challenges and risks
Intense Competitive Landscape and the Impact of New Models
Despite Uniswap’s relative advantage in market share, it faces significant challenges. On one hand, its traditional Ethereum competitors like Curve are holding their ground. On the other hand, Uniswap’s expansion on other EVM L1 and L2 chains is proving difficult, with strong local competitors on each chain (such as Pancake on BNB Chain, Aerodrome on Base, and Camelot on Arbitrum). Emerging trading models also pose a significant challenge: RFQ (Request-For-Quote) protocols and batch auction matching are on the rise. Projects like CoW Swap allow market makers (solvers) to quote prices directly, improving efficiency for large trades and reducing AMM slippage and MEV. This is particularly favored by professional traders and large holders, significantly diverting trading volume from Uniswap. Although Uniswap introduced a similar mechanism with UniswapX, it hasn’t slowed the growth of projects like CoW Swap. Additionally, products with strong front-end advantages, such as wallets and CEXs, are aggressively entering the trading scene, attempting to influence user behavior upstream. This potential shift relegates Uniswap to a more passive “price taker” role in a fiercely competitive pricing environment.
Community Governance Inefficiency and Lack of Value Pegging for Tokens
Investors who have been following the Uniswap governance forum for a long time will find that, compared to other DeFi projects with higher governance efficiency and better reputations (like Aave), Uniswap’s governance efficiency is quite low. This is specifically manifested in slow decision-making, resource wastage, and insufficient focus on strategic metrics. For example: 1. The community’s most concerned issue, the fee switch, has been discussed repeatedly for nearly three years with no result; 2. Various donations and budgets are provided for research and organizations unrelated to Uniswap’s North Star metric (trading volume), but the outcomes have been of little benefit to the project. The low level of community governance and the neglect and tardiness regarding the value pegging of Uni tokens clearly have a long-term negative impact on the tokens’ price.
Valuation benchmark
Since Uniswap has yet to achieve formal protocol revenue and Unichain’s fees are negligible compared to its market value, we use the ratio of Uniswap’s market value to its fees (PF) for both vertical and horizontal valuation comparisons.
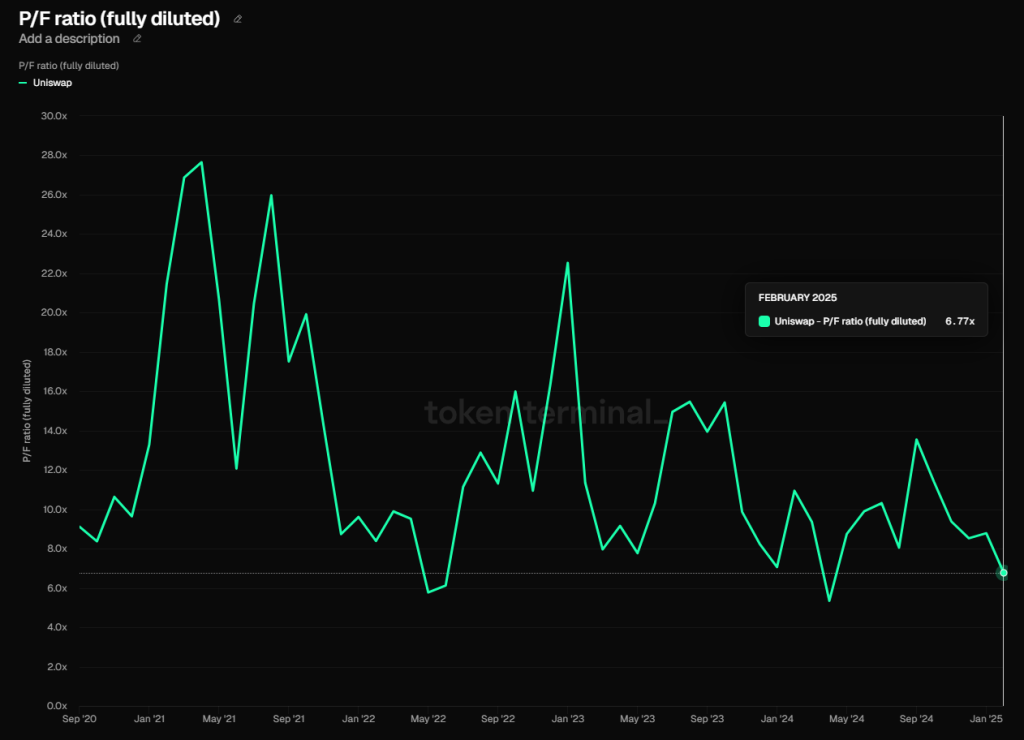
From a vertical comparison, Uniswap’s PF in February this year was 6.77, at an absolute historical low. Since the issuance of Uniswap’s token, only three months have had a lower PF: May and June of 2022 (due to the Three Arrows Capital crisis) and April 2024 (due to a major altcoin pullback and Uniswap receiving a Wells Notice from the SEC). In March, this indicator rose slightly to 7.26. From this indicator, it is evident that the market is extremely pessimistic about the prospects of the Uni token.
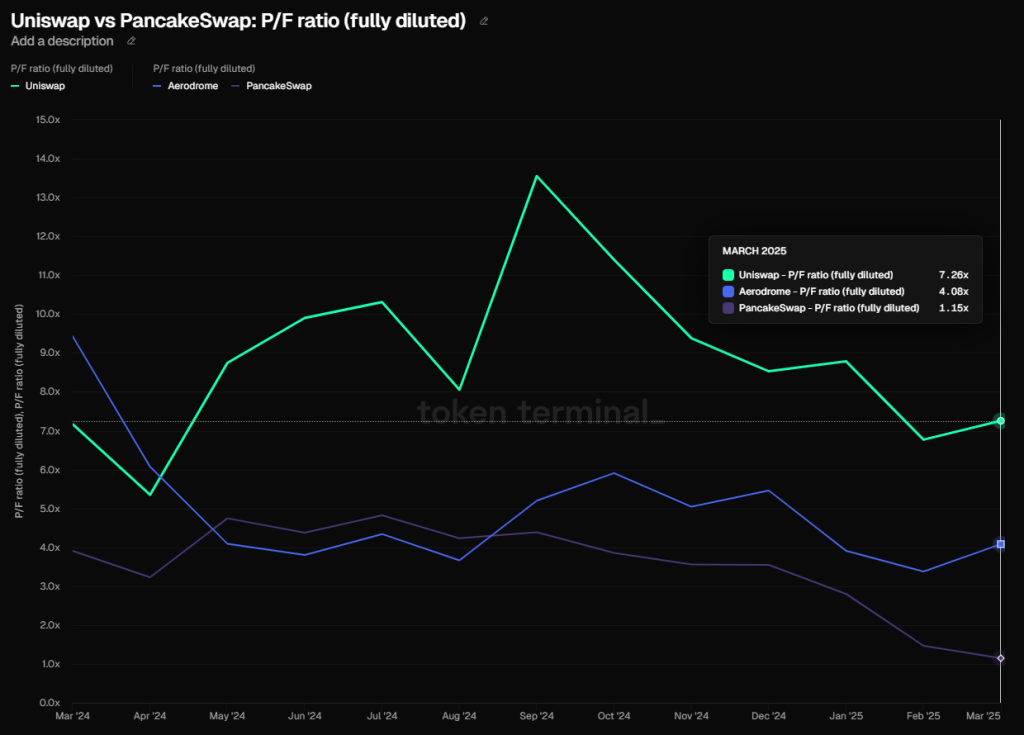
For horizontal comparison, I chose Pancake and Aerodrome, both of which are DEX projects with market shares second only to Uniswap. I did not choose Curve because it has lending as a main business in addition to being a DEX, which makes it less comparable to the other three.
From the PF indicators of these three, Uniswap’s valuation appears significantly higher than Pancake and Aerodrome. However, we need to consider two additional factors:
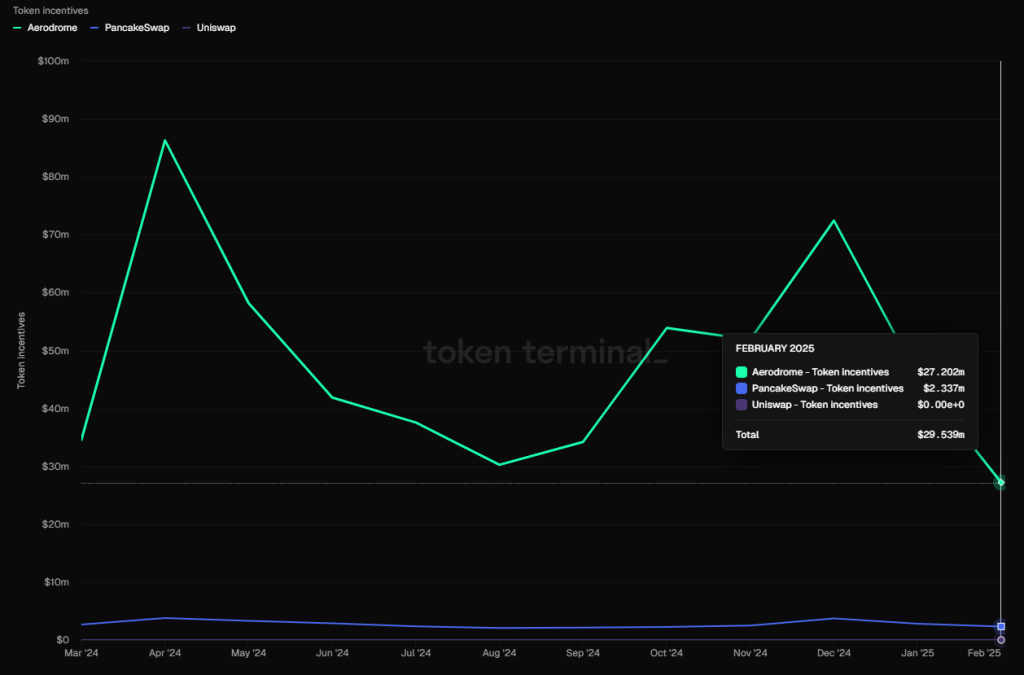
- Uniswap hasn’t provided any token subsidies, whereas Pancake and Aerodrome are still engaging in large-scale token subsidies. Especially Aerodrome, whose token incentives were as high as $27 million in February (See the chart below)
- Uniswap also has Unichain as a second growth curve.
- Uniswap’s multi-chain ecosystem is better developed. Although Pancake has deployed on multiple chains, its operational performance has a significant gap compared to Uniswap, while Aerodrome is a single-chain DEX.
Overall, even considering the business similarities between Uniswap, Pancake, and Aerodrome, the horizontal valuation comparison (Price-to-Fundamental) of Uniswap is less informative than the vertical comparison.
3.3 Jupiter
Current Business Status
Jupiter started with trade aggregation and has expanded through product development and acquisitions, creating a comprehensive ecosystem around Solana’s on-chain transactions. It is also expanding horizontally to other chains and ecosystems. The main products within the Jupiter system include:
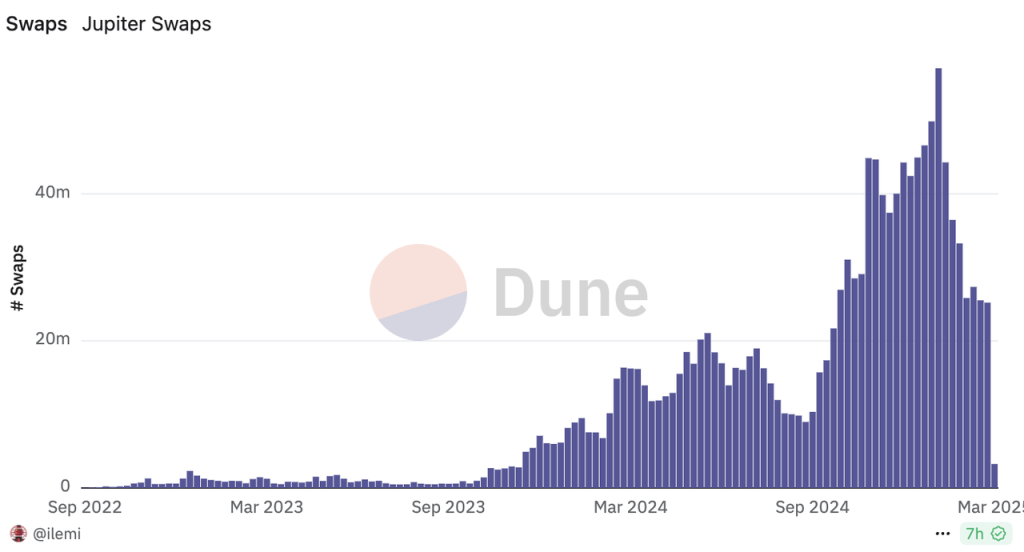
- Main site self-operated trading products: These include aggregated trades (Instant), market orders (Trigger), and conditional orders (Recurring). These were Jupiter’s earliest products and remain the most widely used, with a record 57 million trades in a single day on January 20th.
- The main site’s Trenches product, formerly known as Ape.pro, was initially a specialized tool for memes, similar to products like Phonton/GMGN. However, after being integrated into Trenches in late February, its product format became much like Jupiter’s aggregated trading offerings.
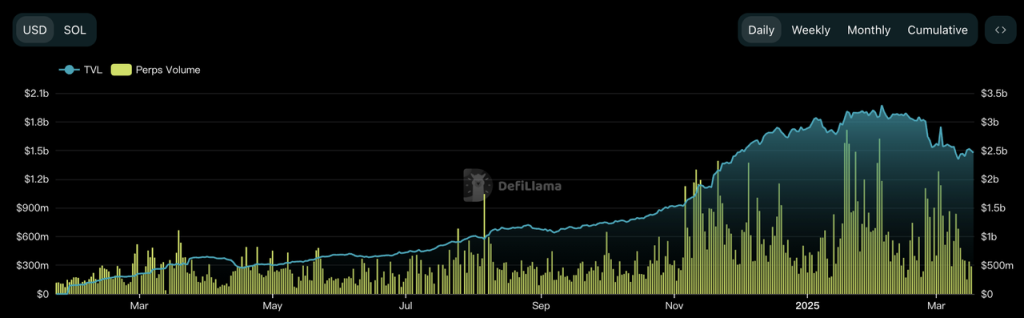
- The main site’s Perps product operates similarly to GMX, providing leveraged long and short positions, as well as yield farming for BTC, ETH, and SOL. The TVL for this segment peaked at over 2 billion, making it a major component of Jupiter′s TVL. During peak times, the average daily trading volume was close to 1 billion, serving as Jupiter’s primary cash flow business in its early stages.
These can be considered Jupiter’s main products at present. In addition, the Jupiter ecosystem also includes the following products:
- The meme trading platform Moonshot. In January 2025, Jupiter announced the acquisition of a majority stake in Moonshot, a rapidly emerging meme trading platform in the past six months. Moonshot has attracted numerous users with its seamless fiat deposit system and smooth trading process, creating a “Moonshot effect,” especially during the launch of TRUMP, which was particularly popular.

- The liquidity platform Meteora. Founded by one of Jupiter’s early co-founders, Ben Chow, Meteora is considered an important part of the Jupiter ecosystem, despite not having a clear control relationship with Jupiter. Meteora plans to issue its own token, and while it belongs to the Jupiter ecosystem, its connection with the JUP token is relatively indirect.
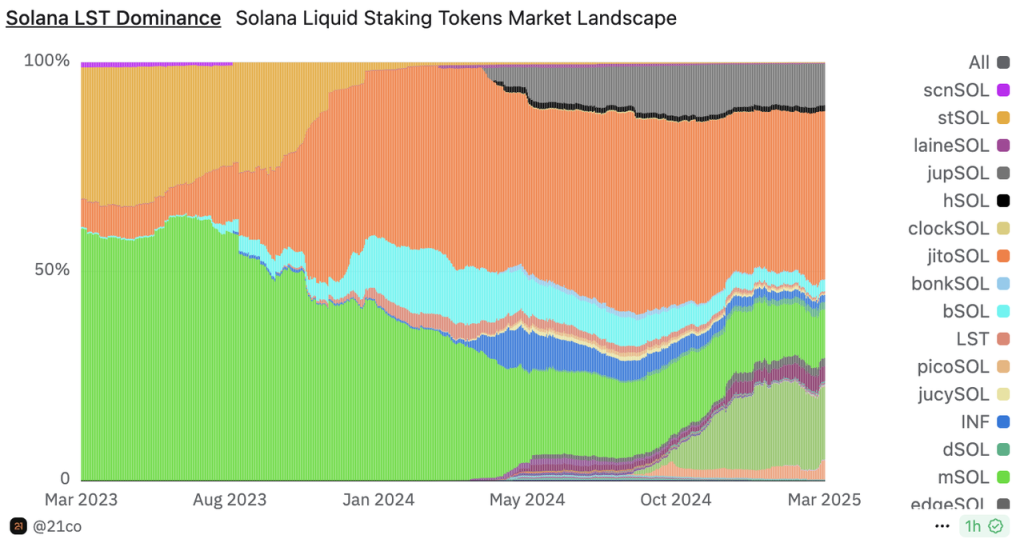
- The LST product jupSOL quickly captured a significant market share after its launch in 2024. Currently, jupSOL ranks fourth after jitoSOL, bnSOL, and mSOL.
- Launchpad LFG: Besides the JUP token itself, LFG launched several projects in 2024, including the governance token ZEUS for the cross-chain communication protocol Zeus, the governance token CLOUD for the LST protocol Sanctum, and the governance token DBR for the cross-chain protocol Debridge, along with other meme projects. Although there are fewer projects launched, the quality is relatively high.
- Investment Portfolio Management Platform Jupiter Portfolio: In January, Jupiter announced the acquisition of the on-chain portfolio tracker Sonarwatch and officially launched Jupiter Portfolio on January 30th.
- Mobile Wallet Jupiter Mobile: After acquiring Solana’s mobile wallet Ultimate Wallet, Jupiter introduced its mobile wallet.
- Cross-Chain Network Jupnet: Launched at the end of January this year, Jupnet aims to allow access to all chains, currencies, and assets with one account. However, it does not yet have a user-friendly version for end consumers.
- Trading Terminal Coinhall: Acquired by Jupiter in September 2024, Coinhall primarily facilitates the trading of Cosmos ecosystem tokens. Through this acquisition, Jupiter gained the capability to build its own trading terminal, which is utilized in its Trenches product. Currently, on-chain trading of Cosmos ecosystem tokens is not very frequent, with daily trading volumes below $10 million.
- In addition to the consumer-facing products mentioned, Jupiter has also been active in other areas, such as acquiring Solana’s browser, SolanaFM. They are developing a variety of products, including the cross-chain network Jupnet.
From a product layout perspective, Jupiter, as the largest consumer gateway on Solana, covers nearly all business directions except for lending. Even in Solana’s diversified business environment, Jupiter’s reach is extensive. Beyond their own operations, they aggressively expand their business boundaries through acquisitions.
Revenue Model
Currently, Jupiter’s revenue-generating services include:
- Aggregated trading services (including Trenches) with fees ranging from 0.05% to 0.1%; spot orders and DCA orders have a fee of 0.1%.
- Derivatives services are based on GMX’s mechanism. The main fees come from a 0.06% charge when opening and closing positions, as well as borrowing fees, price impact fees, etc. However, not all the derivatives fees go to JupiterDAO; 75% of the fees are allocated to liquidity providers (JLP), and the remaining 25% is taken by JupiterDAO.
Other services are offered without fees.
Token Incentives
Jupiter does not have a regular token incentive program. Its main incentives come from two rounds of retrospective airdrops.
Competitive Landscape
Trading is the core service offered by Jupiter. Other services like LST, Launchpad, and wallet can be seen as ways to leverage traffic brought in by trading. Therefore, we’ll focus on analyzing Jupiter’s competitive situation in aggregated and derivative trading.
Aggregated Trading
In the competitive landscape of Solana trading entry points, Jupiter quickly surpassed Orca and Raydium in the first half of 2024, thanks to its multi-liquidity pool routing capabilities and excellent user experience. By Q2 2024, Jupiter held a dominant position, accounting for 51% of Solana’s trading volume (source: Messari)。
However, with the rise of meme tokens and platforms like Pump.fun, specialized meme trading tools such as Photon, Trojan, Bullx, and GMGN rapidly encroached on Jupiter’s market share. These platforms offered faster trading speeds and comprehensive meme trading support, becoming the preferred “meme trading gateways.” In response, Jupiter launched a similar tool, ape.pro, in October last year, but it failed to gain traction and was eventually integrated into the main site’s Trenches product. As a result, Jupiter’s share of Solana’s trading volume dropped to 38% by Q5 2024 (source: Messari)
During the meme frenzy, meme trading accounted for 90% of Solana’s network volume. The loss of market share in meme trading gateways is Jupiter’s biggest challenge in the realm of aggregated trading.
Derivatives Trading
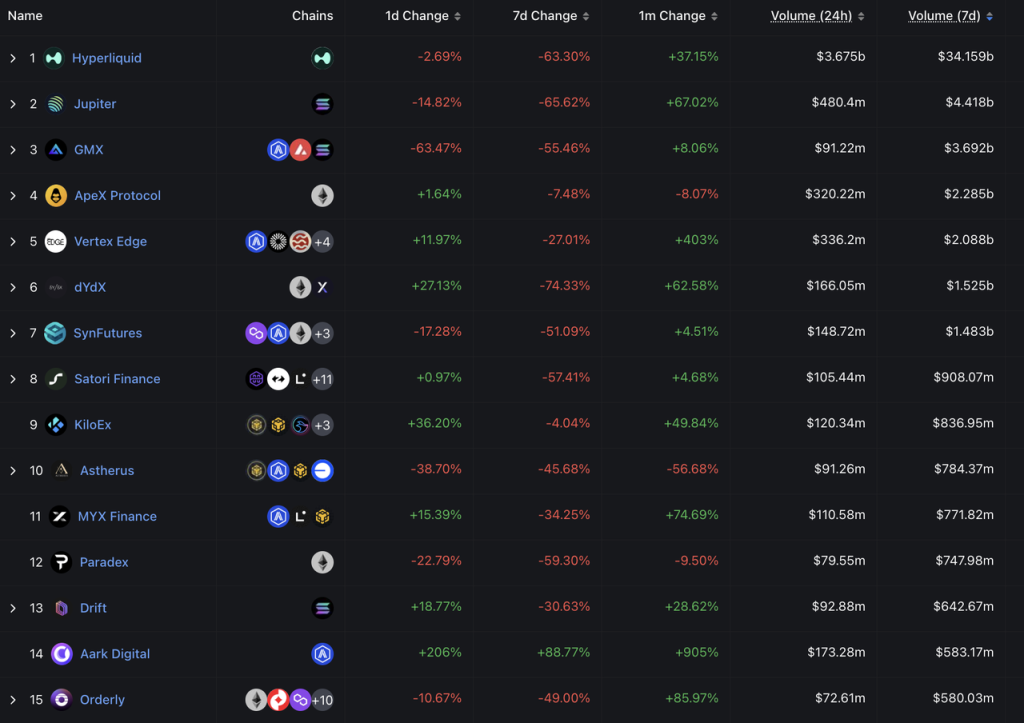
Jupiter’s derivatives exchange is currently the second-largest on-chain derivatives platform, with trading volume second only to Hyperliquid, which we’ll discuss in the next section. Specifically on the Solana chain, Jupiter has a clear advantage over its main competitor, Drift, with its trading volume being roughly 5 to 10 times that of Drift recently.
Looking at DAU, the gap between the two over the past month is also roughly an order of magnitude.
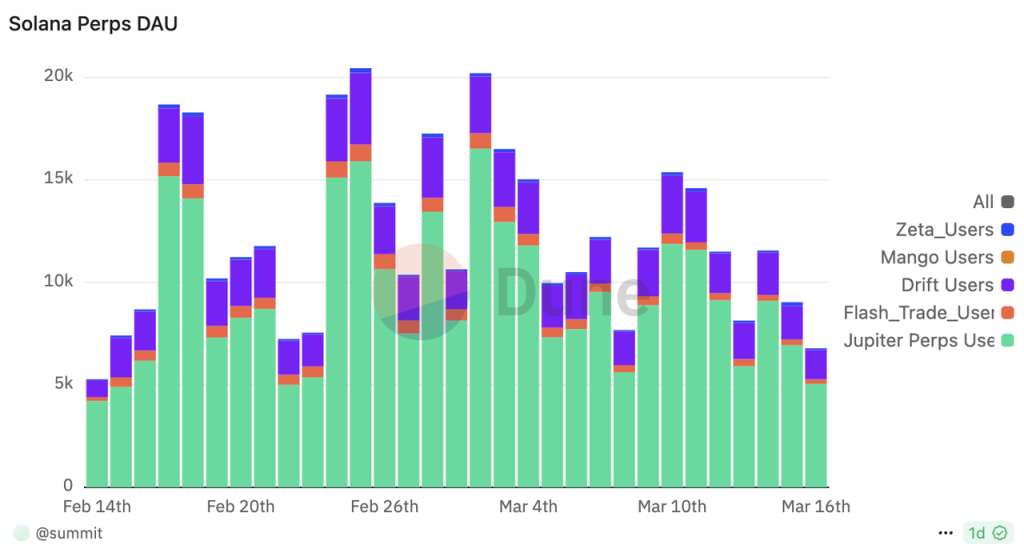
In the derivatives trading field, Jupiter’s position on the Solana network is difficult to shake in the short term.
Main challenges and risks
Despite launching Jupnet to expand cross-chain operations, Jupiter’s core business currently remains on Solana. The biggest uncertainty for Jupiter is whether the Solana network can maintain its prosperity and active on-chain trading.
In addition to the aforementioned challenges related to the Meme trading entry competition, other challenges and risks Jupiter faces include:
Overly Aggressive Expansion, Effectiveness in Doubt
Jupiter’s expansion strategy is much more aggressive than most Web3 projects, with ambitious business ideas that have led to frequent acquisitions over the past year to broaden its scope. However, many of these acquisitions have not achieved the expected results, such as the acquisitions of Moonshot and Coinhall.
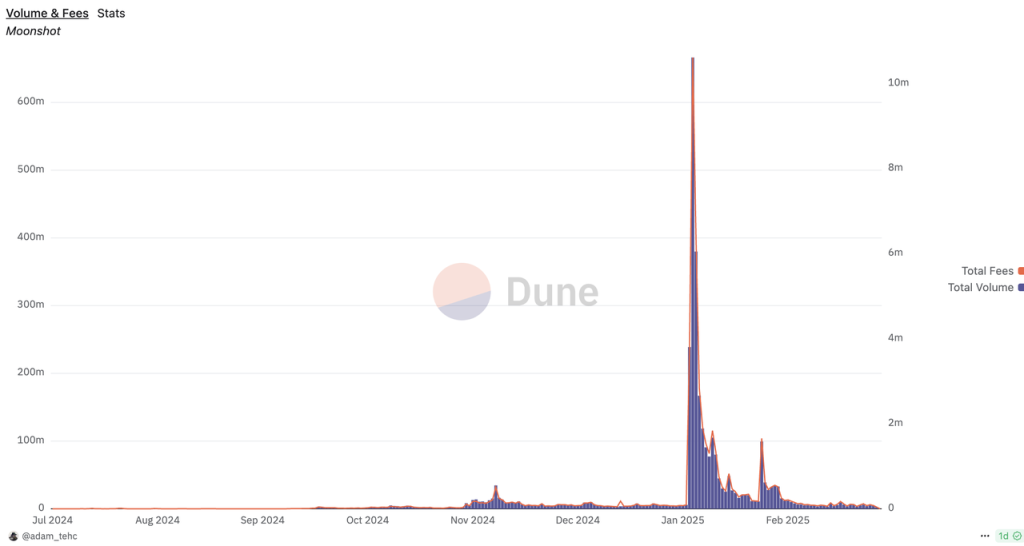
At its peak, Moonshot had a daily trading volume of 660 million and generated revenues of tens of millions of dollars. Currently, the daily trading volume has dropped to less than 5 million, with revenue not exceeding $10,000. Although Jupiter has not disclosed the acquisition costs or payment details, it’s clear that acquiring Moonshot today would be less expensive for JUP token holders.
The acquisition of Coinhall helped Jupiter build its meme trading product, Trenches. However, in terms of both trading volume and market presence, Trenches still lags significantly behind leading meme trading products like Photon, Bullx, Trojan, and GMGN.
No Proprietary Liquidity Pool
Jupiter does not have its own liquidity pool. Its supported platform, Metrora, has started a rewards program and plans to launch an independent token issuance. This means that JupiterDAO, or the JUP token, cannot capture trading fees from the “token trading in liquidity pools” step, fees that have contributed to Raydium’s revenue of over $22 million this past January.
Untested by Bear Market
In a bear market, many assumptions taken for granted during a bull run might be challenged. For example, users trading memes on the Solana chain currently seem willing to pay Jupiter’s 0.05% fee, as competitor meme tools charge between 0.5% to 1%. However, if trading enthusiasm declines during a bear market, users might become more sensitive to transaction fees, putting Jupiter in a conflict between “market share” and “net profit” objectives.
Moreover, Jupiter’s product lineup includes a wallet, the cross-chain network Jupnet, and the portfolio management tool Jupiter Portfolio—all of which are unlikely to generate significant short-term revenue. Maintaining such an extensive product line during a bear market raises significant questions.
Valuation benchmark
JUP has a total supply of 10 billion, with 3 billion tokens burned following a vote at the end of January, leaving a maximum of 7 billion tokens in circulation. Currently, 2.63 billion are circulating, representing a 38.5% circulation rate. Among the non-circulating tokens, 810 million team tokens will begin vesting over the next 21 months. Additionally, 700 million tokens will be released in a Jupiter airdrop in January next year. With an inflation rate exceeding 40% over the next year, JUP remains a low-circulation, high-inflation token.
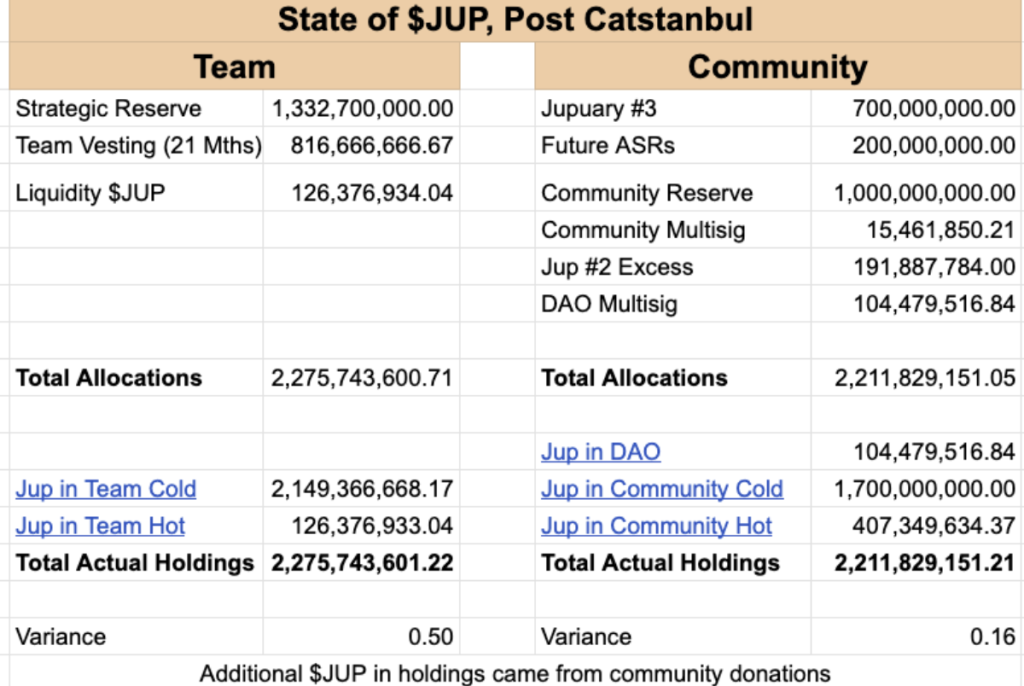
At the end of January, Jupiter announced that 50% of its protocol revenue will be used to buy back JUP, with purchased JUP being locked for three years.
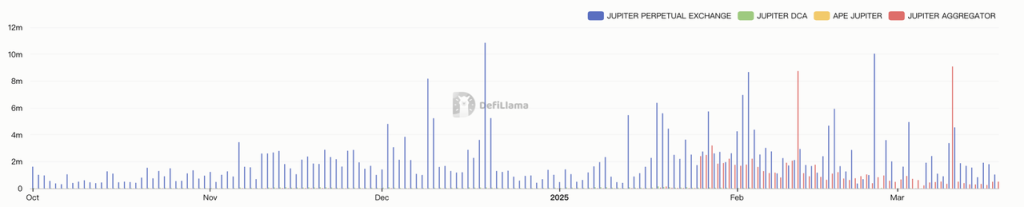
The chart below, sourced from DeFiLlama, shows Jupiter’s protocol revenue since last October. Note that unusual values for Jupiter’s aggregator revenue on February 10th and March 10th may contain errors; however, I couldn’t find alternative data sources for Jupiter’s revenue. It’s evident that Jupiter’s main income currently comes from derivatives trading (blue bars), which is partly due to the significant decline in meme trading enthusiasm since the introduction of fees by the Jupiter aggregator.
Since Jupiter just completed a significant economic model update at the end of January, introducing a transaction fee of 0.05%-0.1%, the P/S data for February and March are more relevant.
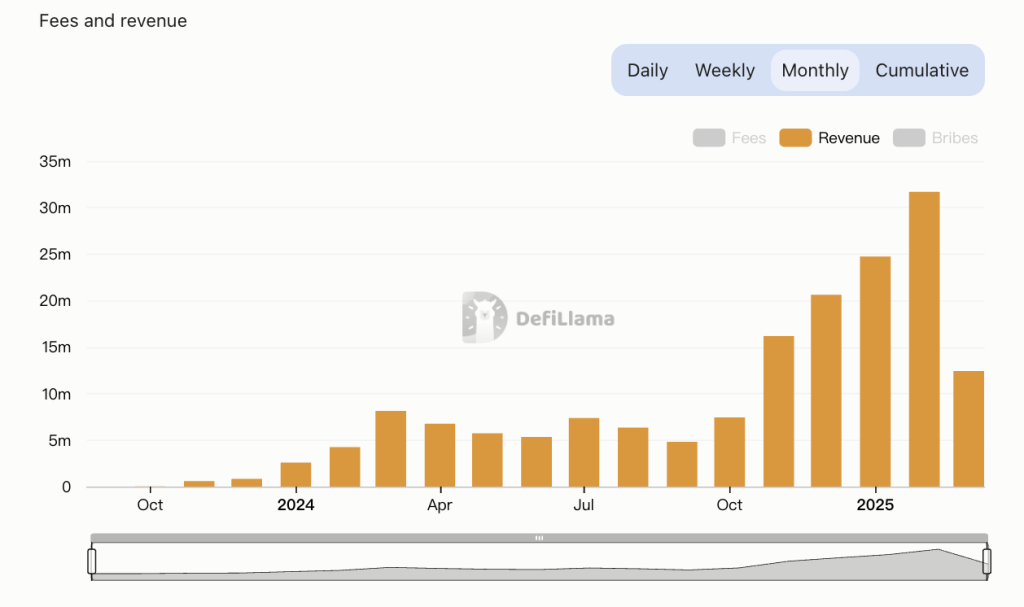
According to data collected by DeFiLlama, Jupiter’s revenue for February was 31.7 million, with an annualized revenue of 380 million. This corresponds to a P/S (circulating) of 3.65 and a P/S (fully diluted) of 9.5. As of March 18th, the revenue was 12.25 million, translating to an annualized revenue of 253 million, with a P/S (circulating) of 5.45 and a P/S (fully diluted) of 14.15.
Whether comparing horizontally with CoW Swap or vertically with Jupiter itself, the current valuation of JUP seems relatively low.
Of course, these figures are based on the recent popularity of Solana. As Solana’s hype potentially decreases in a bear market, maintaining such high revenue will be challenging. We’ve already observed this trend when comparing data from March to February.
